Product
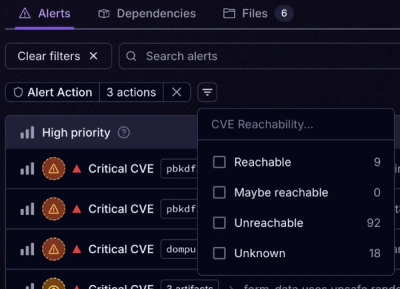
Introducing Tier 1 Reachability: Precision CVE Triage for Enterprise Teams
Socket’s new Tier 1 Reachability filters out up to 80% of irrelevant CVEs, so security teams can focus on the vulnerabilities that matter.
Tiny python debugging utility modeled after visionmedia's node.js debug module and the python 3 print function
::
$ python setup.py install
With debug you simply invoke the exported function to generate your
debug function, passing it a name which will determine if a noop
function is returned, or custom decorated function that emulates the
python 3 print function but, by default, prints to sys.stderr. A
unique color is selected per-function for visibility.
Example test.py:
.. code:: py
import pydebug
import time

#
# pydebug.debug(name)
#
# once you have initialized the debug module you can call it as shown below
#
# debug(*objects, sep=' ', end='\n', file=sys.stderr, flush=False)
#

debug = pydebug.debug("test")
debug("hi there2")

debug2 = pydebug.debug("test2")
debug2("awesome")

debug({"awesome": True}, True, 1, "test")
debug([], {1,2,3}, {"awesome": True}, True, 1, "test")

time.sleep(0.1)
debug('should be milliseconds now')

time.sleep(1)
debug('should be seconds now')
The DEBUG environment variable is then used to enable these based on space or comma-delimited names. Here are some examples:
::
$ DEBUG=* python test_pydebug.py
$ DEBUG=test python test_pydebug.py
$ DEBUG=test2 python test_pydebug.py
$ DEBUG=test* python test_pydebug.py
When actively developing an application it can be useful to see when the
time spent between one debug() call and the next. Suppose for
example you invoke debug() before requesting a resource, and after
as well, the "+NNNus" will show you how much time was spent between
calls.
When the file is not a TTY, to_utc_string() is called which mimicks
the default behavior of the Javascript Date#toUTCString() method
used in the node.js debug module, making it more useful for logging the
debug information as shown below
::
$ DEBUG=* python test_pydebug.py 2>&1 | grep test
$ DEBUG=* python test_pydebug.py 2>&1 | grep test2
If you're using this in one or more of your libraries, you should use the name of your library so that developers may toggle debugging as desired without guessing names. If you have more than one debuggers you should prefix them with your library name and use ":" to separate features. For example "bodyParser" from Connect would then be "connect:bodyParser".
The "*" character may be used as a wildcard. Suppose for example your
library has debuggers named "connect:bodyParser", "connect:compress",
"connect:session", instead of listing all three with
DEBUG=connect:bodyParser,connect.compress,connect:session, you may
simply do DEBUG=connect:*, or to run everything using this module
simply use DEBUG=*.
You can also exclude specific debuggers by prefixing them with a "-" character or whitespace. For example:
::
$ DEBUG=test2,-test python test_pydebug.py
$ DEBUG="test2 -test" python test_pydebug.py
The MIT License (MIT)
Copyright (c) 2013 Malcom Gilbert
Permission is hereby granted, free of charge, to any person obtaining a copy of this software and associated documentation files (the "Software"), to deal in the Software without restriction, including without limitation the rights to use, copy, modify, merge, publish, distribute, sublicense, and/or sell copies of the Software, and to permit persons to whom the Software is furnished to do so, subject to the following conditions:
The above copyright notice and this permission notice shall be included in all copies or substantial portions of the Software.
THE SOFTWARE IS PROVIDED "AS IS", WITHOUT WARRANTY OF ANY KIND, EXPRESS OR IMPLIED, INCLUDING BUT NOT LIMITED TO THE WARRANTIES OF MERCHANTABILITY, FITNESS FOR A PARTICULAR PURPOSE AND NONINFRINGEMENT. IN NO EVENT SHALL THE AUTHORS OR COPYRIGHT HOLDERS BE LIABLE FOR ANY CLAIM, DAMAGES OR OTHER LIABILITY, WHETHER IN AN ACTION OF CONTRACT, TORT OR OTHERWISE, ARISING FROM, OUT OF OR IN CONNECTION WITH THE SOFTWARE OR THE USE OR OTHER DEALINGS IN THE SOFTWARE.
FAQs
Tiny python debugging utility modeled after visionmedia's node.js debug module
We found that pydebug demonstrated a healthy version release cadence and project activity because the last version was released less than a year ago. It has 1 open source maintainer collaborating on the project.
Did you know?

Socket for GitHub automatically highlights issues in each pull request and monitors the health of all your open source dependencies. Discover the contents of your packages and block harmful activity before you install or update your dependencies.

Product
Socket’s new Tier 1 Reachability filters out up to 80% of irrelevant CVEs, so security teams can focus on the vulnerabilities that matter.

Research
/Security News
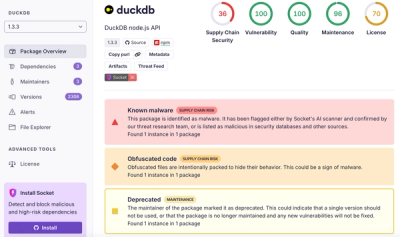
Ongoing npm supply chain attack spreads to DuckDB: multiple packages compromised with the same wallet-drainer malware.

Security News
The MCP Steering Committee has launched the official MCP Registry in preview, a central hub for discovering and publishing MCP servers.