Security News
NVD Concedes Inability to Keep Pace with Surging CVE Disclosures in 2025
Security experts warn that recent classification changes obscure the true scope of the NVD backlog as CVE volume hits all-time highs.
RNAglib: Tools for learning on the structure of RNA using 2.5D geometric representations

rnaglib)RNAglib is a Python package for studying RNA 2.5D and 3D structures. Functionality includes automated data loading,
analysis, visualization, ML model building and benchmarking.

A web-based documentation is available at rnaglib.org.
We host RNAs annotated with molecule, base pair, and nucleotide level attributes. These include, but are not limited to:
To install the tool, follow the steps in INSTALL.md.

rnaglib?A quickstart and tutorials are available in our online documentation: rnaglib.org. In this readme we briefly review the functionality of rnaglib:
We now provide datasets of RNA 3D structures ready-to-use for machine learning model benchmarking in seven biologically relevant tasks. Moreover, we provide many tools to create your own new tasks. A more detailed description is provided in the Tasks' README and in the documentation.
Everything you need to train and evaluate a model is built on 3 basic ingredients:
rnaglib.Task object with holds all the relevant data, splits and functionality.rnaglib.Representation object which converts raw RNAs to tensor formats.rnaglib.learning.PyGmodelfrom rnaglib.tasks import ChemicalModification
from rnaglib.transforms import GraphRepresentation
from rnaglib.learning.task_models import PygModel
# Load task, representation, and get loaders
task = ChemicalModification(root="my_root")
model = PygModel.from_task(task)
pyg_rep = GraphRepresentation(framework="pyg")
task.add_representation(pyg_rep)
train_loader, val_loader, test_loader = task.get_split_loaders(batch_size=8)
for batch in train_loader:
batch = batch['graph'].to(model.device)
output = model(batch)
test_metrics = model.evaluate(task, split='test')
Current release contains annotations generated by x3dna-dssr as well as some additional ones that we added for all available PDBs at the time of release.
Each RNA is stored as a networkx graph where nodes are residues and edges are backbone and base pairing edges. The networkx graph object has graph-level, node-level and edge-level attributes. Here is a reference for all the annotations currently available.
>>> from rnaglib.dataset import rna_from_pdbid
>>> rna_dict = rna_from_pdbid('1fmn')  # fetch from local database or RCSB if not found
>>> rna_dict['rna'].graph  # display graph-level features
{'name': '1fmn', 'pdbid': '1fmn', 'ligand_to_smiles': {'FMN': 'Cc1cc2c(cc1C)N(C3=NC(=O)NC(=O)C3=N2)CC(C(C(COP(=O)(O)O)O)O)O'}, 'ss': {'A': '..(((((......(((....))).....)))))..'}, 'seq': {'A': 'GGCGUGUAGGAUAUGCUUCGGCAGAAGGACACGCC'}}
In addition to analysing RNA data, RNAglib also distributes available parsed RNA structures. Databases of annotated structures can be downloaded directly from Zenodo.
| Version | Date | Total RNAs | Total Non-Redundant | Non-redundant version | rnaglib commit |
|---|---|---|---|---|---|
| 2.0.2 | 25-02-25 | 8441 | 2921 | 3.375 | ac303c7 |
| 2.0.0 | 12-01-25 | 8305 | 2877 | 3.369 | 33a9e989 |
| 1.0.0 | 15-02-23 | 5759 | 1176 | 3.269 | 5446ae2c |
| 0.0.0 | 20-07-21 | 3739 | 899 | 3.186 | eb25dabd |
They can also be obtained through the provided command line utility, where you can specify the version and redundancy.
$ rnaglib_download -r all|nr
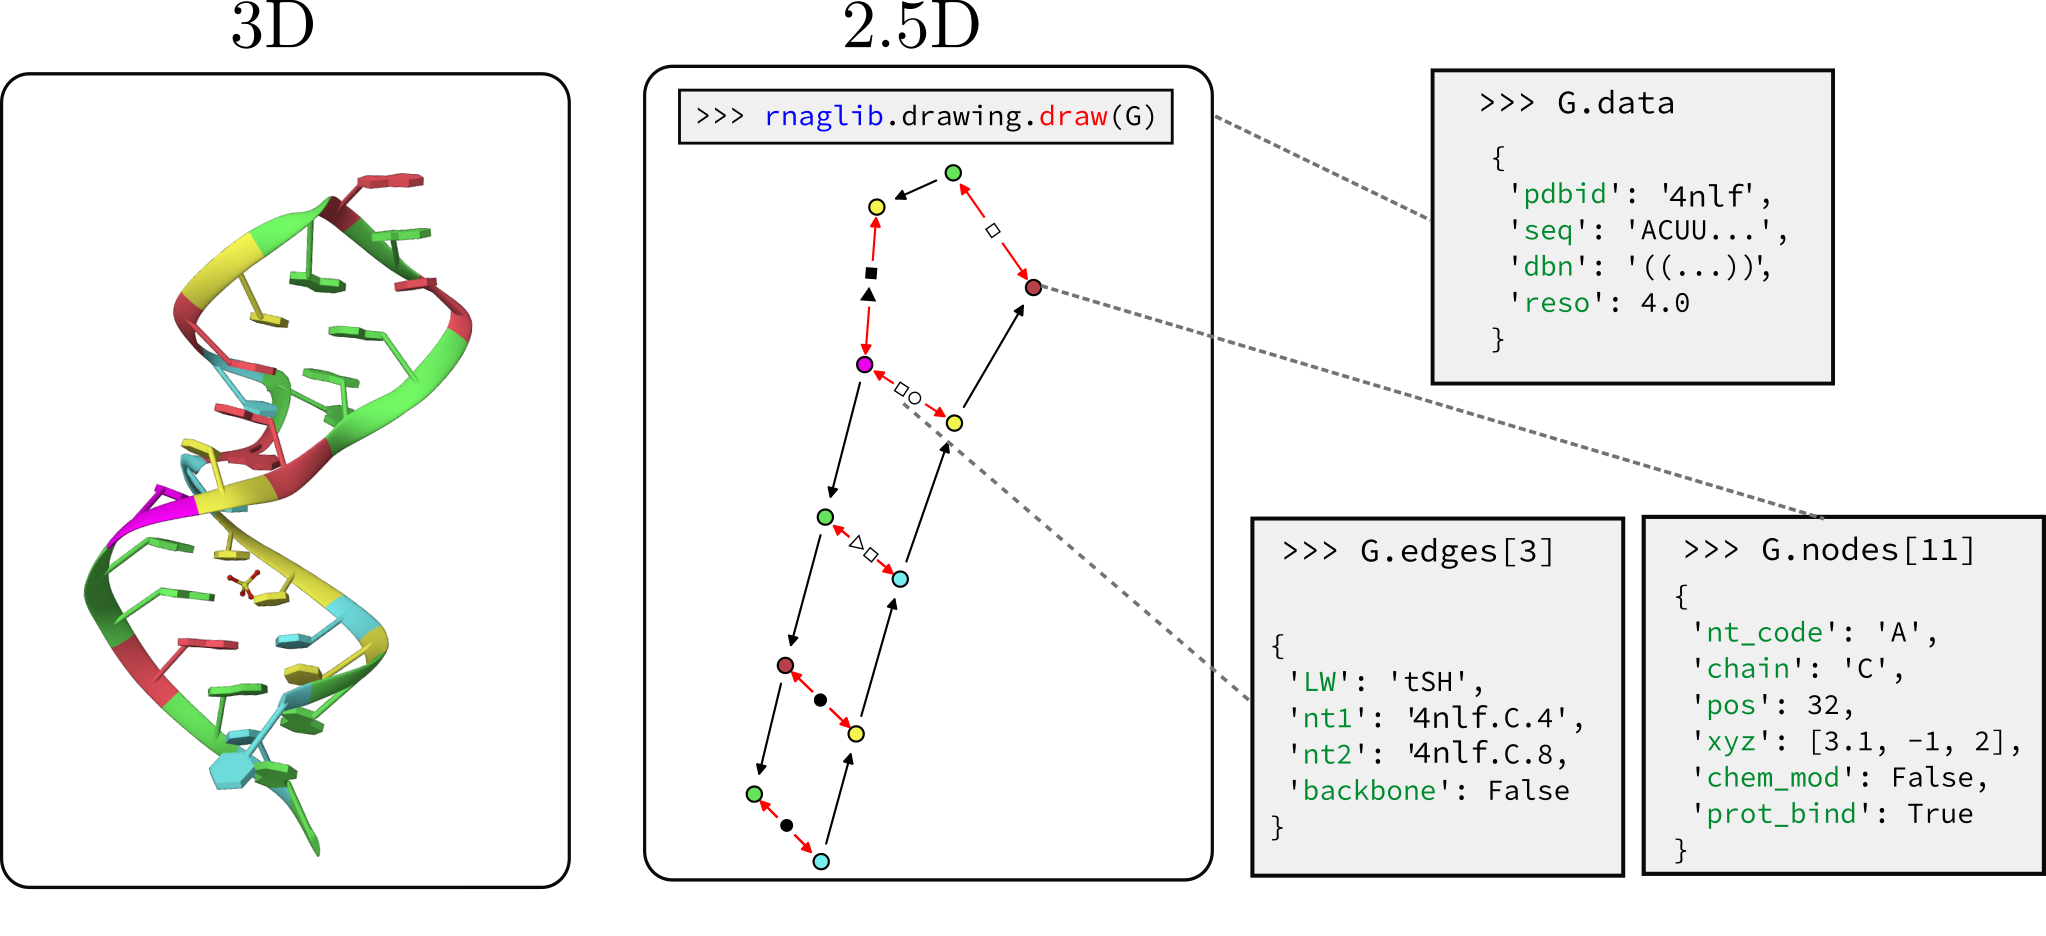
You can extract Leontis-Westhof interactions and convert 3D structures to 2.5D graphs. We wrap a fork of fr3d-python to support this functionality.
from rnaglib.prepare_data import fr3d_to_graph

G = fr3d_to_graph("../data/structures/1fmn.cif")
Warning: this method currently does not support non-standard residues. Support coming soon. Up to version 1.0.0 of the RNA database were created using x3dna-dssr which do contain non-standard residues.
We customize networkx graph drawing functionalities to give some convenient visualization of 2.5D base pairing networks. This is not a dedicated visualization tool, it is only intended for quick debugging. We point you to VARNAhttps://varna.lisn.upsaclay.fr/ or RNAscape for a full-featured visualizer.
from rnaglib.drawing import rna_draw

rna_draw(G, show=True, layout="spring")

When dealing with 3D structures as 2.5D graphs we support graph-level comparison through the graph edit distance.
from rnaglib.algorithms import graph_edit_distance
from rnaglib.dataset import rna_from_pdbid

G = rna_from_pdbid("4nlf")["rna"]
print(graph_edit_distance(G, G))  # 0.0
@article{mallet2022rnaglib,
  title={RNAglib: a python package for RNA 2.5 D graphs},
  author={Mallet, Vincent and Oliver, Carlos and Broadbent, Jonathan and Hamilton, William L and Waldisp{\"u}hl, J{\'e}r{\^o}me},
  journal={Bioinformatics},
  volume={38},
  number={5},
  pages={1458--1459},
  year={2022},
  publisher={Oxford University Press}
}
rnaglibIf you use rnaglib in one of your projects, please cite and feel free to make a pull request so we can list your project here.
rnaglib@cs.mcgill.caFAQs
RNAglib: Tools for learning on the structure of RNA using 2.5D geometric representations
We found that rnaglib demonstrated a healthy version release cadence and project activity because the last version was released less than a year ago. It has 2 open source maintainers collaborating on the project.
Did you know?

Socket for GitHub automatically highlights issues in each pull request and monitors the health of all your open source dependencies. Discover the contents of your packages and block harmful activity before you install or update your dependencies.

Security News
Security experts warn that recent classification changes obscure the true scope of the NVD backlog as CVE volume hits all-time highs.

Security Fundamentals
Attackers use obfuscation to hide malware in open source packages. Learn how to spot these techniques across npm, PyPI, Maven, and more.

Security News
Join Socket for exclusive networking events, rooftop gatherings, and one-on-one meetings during BSidesSF and RSA 2025 in San Francisco.