Product
Introducing Rust Support in Socket
Socket now supports Rust and Cargo, offering package search for all users and experimental SBOM generation for enterprise projects.
Simple utility to plot stacked waterfalls using matplotlib
Drew inspiration from waterfall_ax
pip install stackedwaterfalls
stackedwaterfalls expects a list of list, where each sublist represents a bar, and it's elements represent stacks within that bar.
Here's a simple example:
from stackedwaterfalls import StackedWaterfalls as sw

aircomp  =  [[0.74] , [0.16], [0.05, 0.05]]
names = [['N$_2$'], ['O$_2$'], ['AR','H$_2$O']] # Labels of input values

air = sw(aircomp, names)
air.plot()

The colors are automatically picked if nothing is specified in a manner that every subsequent bar has as different a color from the previous as possible based on this great answer here.
This example shows how you can do a bunch of things with this:
colors = [['silver'] , ['skyblue'], ['orange', 'royalblue']]

A = sw(LH2_wind, names, colors)
A.plot(shadecolor = 'green', total = True,
       grouplabel ='Group Label = $\\frac{gas_i}{total}$',
       barnames = ["Major", "Major", "Oh no!\nToo much Argon"],
        legkw={'ncol':3,'framealpha':1.0, 'loc':'best', 'fontsize':15}, totalcolor = 'darkred',
       linkskw={'ls':'-.','lw':0.8, 'color':'k', 'alpha':1.0}, grouplabelstyle="]-")

A.ax.set_ylim(0,1.2)

The plotting routine also returns the extent of the x axis that is used so you can use that to add graphs to the right as follows:
names = [['A'], ['B', 'C','D'], ['E', 'F']] # Labels of input values
data_set1 =  [[0.3] , [0.2, 0.0, 0.0], [0.0, 0.030]]
data_set2 =  [[0.3] , [0.3, 0.0, 0.0], [0.0, 0.030]]
data_set3 =  [[0.6] , [1e-16  , 0.8, 0.1], [0.01, 1e-16]] #need to set 0's here to very small num that is not zero to force legend elements
colors = [['deepskyblue'], ['royalblue', 'silver','darkorange'], ['brown', 'grey']]

d1 = StackedWaterfalls(data_set1,names, colors)
d2 = StackedWaterfalls(data_set2,names, colors)
d3 = StackedWaterfalls(data_set3,names, colors)

ax, xst2 = d1.plot(shadecolor = 'cornflowerblue',
                   legend=False, linkskw={'lw':'2', 'color':'red', 'alpha':0.1}, total = True,
                   grouplabel = "Set 1", barnames=["One", "Two", "Three"], grouplabelstyle = ']')

ax, xst3 =  d2.plot(shadecolor = 'yellow', ax = ax, xstart = xst2+0.4, total = True,grouplabel = "Set 2",
                    grouplabelstyle = "|-",
                    legend=False)
ax, xst4 =  d3.plot(shadecolor = 'red', ax = ax, xstart = xst3+0.4, total = True, grouplabel = "Set 3",
                    grouplabelstyle = "|",
                    legend=True,  legkw={'ncol':3,'framealpha':1.0, 'loc':'best', 'fontsize':15})


ax.grid()
ax.set_ylim(0, 1.8)
plt.tight_layout()

FAQs
A small utility to create stacked waterfalls using matplotlib
We found that stackedwaterfalls demonstrated a healthy version release cadence and project activity because the last version was released less than a year ago. It has 1 open source maintainer collaborating on the project.
Did you know?

Socket for GitHub automatically highlights issues in each pull request and monitors the health of all your open source dependencies. Discover the contents of your packages and block harmful activity before you install or update your dependencies.

Product
Socket now supports Rust and Cargo, offering package search for all users and experimental SBOM generation for enterprise projects.

Product
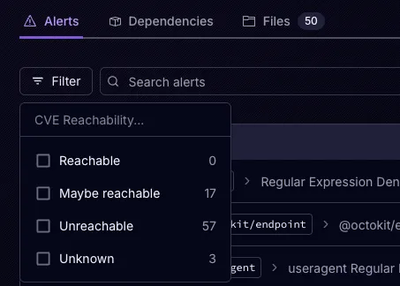
Socket’s precomputed reachability slashes false positives by flagging up to 80% of vulnerabilities as irrelevant, with no setup and instant results.

Product
Socket is launching experimental protection for Chrome extensions, scanning for malware and risky permissions to prevent silent supply chain attacks.