Product
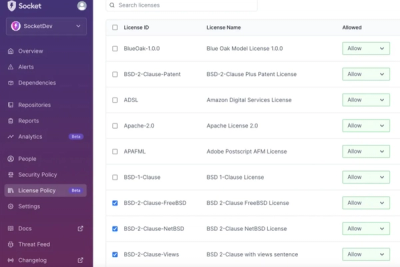
Introducing License Enforcement in Socket
Ensure open-source compliance with Socket’s License Enforcement Beta. Set up your License Policy and secure your software!
By Philipp Burckhardt - Oct 17, 2024
A collection of methods for data stacking
A collection of methods for stacking of generic time series data.
This package is under active development. The currently available modules are listed here.
utils: This module contains frequently used utility functions.
core: This module contains core stacking functions.
stackmaster package functions using pip$ pip install stackmaster
This step will install the StackMaster package. The modules would then be imported under any working directory.
cd to the directory you want to save the package files. Then run:
$ pip install .
Run the following commands to test your installation, under the root directory of StackMaster.
iimport os,pickle
import numpy as np
import matplotlib.pyplot as plt
from stackmaster.core import stack
from scipy.signal import sosfiltfilt, butter

dataroot='./data'
dfile=dataroot+"/stackmaster_testdataset.pk"
d=pickle.load(open(dfile,'rb'))

scale=60
data,dt,lag,d_id=[d["data"],d["dt"],d['lag'],d['id']]
tx=np.arange(-lag,lag+0.5*dt,dt)
extent=[-lag,lag,data.shape[0],0]
dn=data.copy()

sos=butter(4,[0.05,0.5],fs=1/dt,btype="bandpass",output='sos')

stack_method="robust"

for i in range(data.shape[0]):
    dn[i,:]=sosfiltfilt(sos,data[i,:]/np.max(np.abs(data[i,:])))

## plot
plt.figure(figsize=(10,5),facecolor="w")
plt.imshow(dn,extent=extent,cmap="seismic",aspect="auto")

dstack=stack(dn,method=stack_method)
plt.plot(tx,scale*dstack+0.5*data.shape[0],'k',lw=2,label=stack_method)
plt.vlines(0,0,data.shape[0],'k')
plt.xlim([-200,200])
plt.ylim([0,data.shape[0]])
plt.xticks(fontsize=14)
plt.yticks(fontsize=14)
plt.title(d_id)
plt.xlabel("time (s)",fontsize=14)
plt.ylabel("order",fontsize=14)
plt.legend(fontsize=12)
plt.show()
You should get a plot of the data and the stacked trace.
See https://github.com/xtyangpsp/StackMaster for tutorials and more detailed descriptions.
Any bugs and ideas are welcome. Please file an issue through GitHub https://github.com/xtyangpsp/StackMaster.
FAQs
A collection of methods for data stacking
We found that stackmaster demonstrated a healthy version release cadence and project activity because the last version was released less than a year ago. It has 1 open source maintainer collaborating on the project.
Did you know?

Socket for GitHub automatically highlights issues in each pull request and monitors the health of all your open source dependencies. Discover the contents of your packages and block harmful activity before you install or update your dependencies.
Product
Ensure open-source compliance with Socket’s License Enforcement Beta. Set up your License Policy and secure your software!
Product
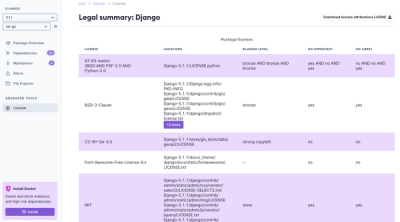
We're launching a new set of license analysis and compliance features for analyzing, managing, and complying with licenses across a range of supported languages and ecosystems.
Product
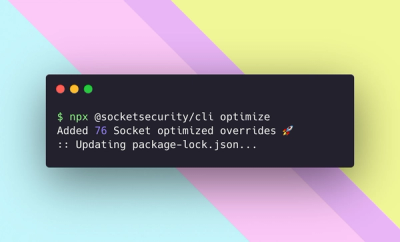
We're excited to introduce Socket Optimize, a powerful CLI command to secure open source dependencies with tested, optimized package overrides.