Outline ss-server


This repository has the Shadowsocks backend used by the Outline Server.
The Outline Shadowsocks service allows for:
- Multiple users on a single port.
- Does so by trying all the different credentials until one succeeds.
- Multiple ports
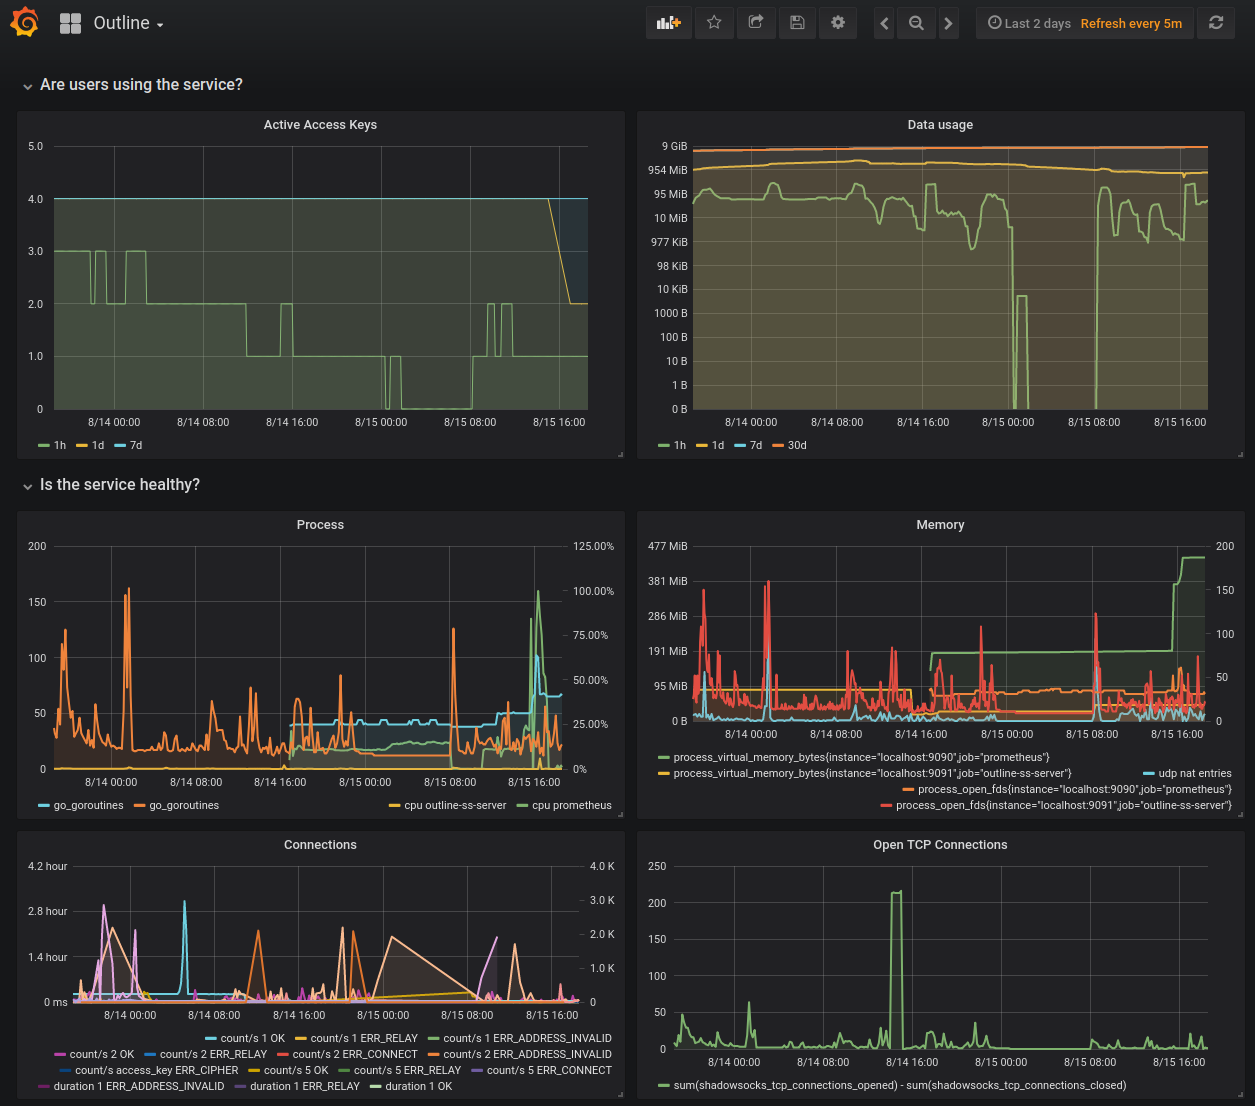
- Whitebox monitoring of the service using prometheus.io
- Includes traffic measurements and other health indicators.
- Live updates via config change + SIGHUP
- Replay defense (add
--replay_history 10000). See PROBES for details.

How to run it
Call the outline-ss-server command with the recommended flags, as done by the official Outline Server:
outline-ss-server -replay_history=10000 -metrics=127.0.0.1:9091 -config=$CONFIG_YML -ip_country_db=$COUNTRY_MMDB -ip_asn_db=$ASN_MMDB
Flags:
replay_history: Enables replay protection for the last 10000 connections.metrics: Where the webserver exposing the Prometheus metrics will listen on. You should specify localhost so it's not accessible from outside the machine, unless you know what you are doing.config: The config file with the access keys. See the config example.ip_country_db: The IP-Country MMDB file to enable per-country metrics breakdown.ip_asn_db: The IP-ASN MMDB file to enable per-country metrics breakdown.
In the example, you can open https://127.0.0.1:9091 on your browser to see the exported Prometheus metrics.
To fetch and update MMDB files from DB-IP, you can do something like the update_mmdb.sh from the Outline Server.
Full Working Example: Try It!
Download the Prometheus binary.
Run the server
On Terminal 1, from the repository directory, build and start the SS server:
go run ./cmd/outline-ss-server -config cmd/outline-ss-server/config_example.yml -metrics localhost:9091 --replay_history=10000
In production, you may want to specify -ip_country_db to get per-country metrics. See how the Outline Server calls outline-ss-server.
Run the Prometheus scraper for metrics collection
On Terminal 2, start prometheus scraper for metrics collection:
prometheus --config.file=cmd/outline-ss-server/prometheus_example.yml
Run the SOCKS-to-Shadowsocks client
On Terminal 3, start the SS client:
go run github.com/shadowsocks/go-shadowsocks2@latest -c ss://chacha20-ietf-poly1305:Secret0@:9000 -verbose -socks localhost:1080
Fetch a page over Shadowsocks
On Terminal 4, fetch a page using the SS client:
curl --proxy socks5h://localhost:1080 example.com
Stop and restart the client on Terminal 3 with "Secret1" as the password and try to fetch the page again on Terminal 4.
Check the metrics
Open http://localhost:9091/metrics and see the exported Prometheus variables.
Open http://localhost:9090/ and see the Prometheus server dashboard.
Performance Testing
Start the iperf3 server (runs on port 5201 by default):
iperf3 -s
Start the SS server (listening on port 9000):
go run ./cmd/outline-ss-server -config cmd/outline-ss-server/config_example.yml
Start the SS tunnel to redirect port 8000 -> localhost:5201 via the proxy on 9000:
go run github.com/shadowsocks/go-shadowsocks2@latest -c ss://chacha20-ietf-poly1305:Secret0@:9000 -tcptun ":8000=localhost:5201" -udptun ":8000=localhost:5201" -verbose
Test TCP upload (client -> server):
iperf3 -c localhost -p 8000
Test TCP download (server -> client):
iperf3 -c localhost -p 8000 --reverse
Test UDP upload:
iperf3 -c localhost -p 8000 --udp -b 0
Test UDP download:
iperf3 -c localhost -p 8000 --udp -b 0 --reverse
Compare to go-shadowsocks2
Run the commands above, but start the SS server with
go run github.com/shadowsocks/go-shadowsocks2 -s ss://chacha20-ietf-poly1305:Secret0@:9000 -verbose
Compare to shadowsocks-libev
Start the SS server (listening on port 10001):
ss-server -s localhost -p 10001 -m chacha20-ietf-poly1305 -k Secret1 -u -v
Start the SS tunnel to redirect port 10002 -> localhost:5201 via the proxy on 10001:
ss-tunnel -s localhost -p 10001 -m chacha20-ietf-poly1305 -k Secret1 -l 10002 -L localhost:5201 -u -v
Run the iperf3 client tests listed above on port 10002.
You can mix and match the libev and go servers and clients.
Tests and Benchmarks
To run the tests and benchmarks, call:
go run github.com/go-task/task/v3/cmd/task test
You can benchmark the cipher finding code with
go test -cpuprofile cpu.prof -memprofile mem.prof -bench . -benchmem -run=^$ github.com/Jigsaw-Code/outline-ss-server/shadowsocks
You can inspect the CPU or memory profiles with go tool pprof cpu.prof or go tool pprof mem.prof, and then enter web on the prompt.
Release
We use GoReleaser to build and upload binaries to our GitHub releases.
Summary:
-
Test the build locally:
go run github.com/go-task/task/v3/cmd/task release-local
-
Export an environment variable named GITHUB_TOKEN with a temporary repo-scoped GitHub token (create one here):
read -s -p "Type your Github token:" GITHUB_TOKEN
export GITHUB_TOKEN
-
Create a new tag and push it to GitHub e.g.:
git tag v1.0.0
git push origin v1.0.0
-
Build and upload:
go run github.com/go-task/task/v3/cmd/task release
-
Go to https://github.com/Jigsaw-Code/outline-ss-server/releases, review and publish the release.
-
Delete the Github token you created for the release on the Personal Access Tokens page.
Full instructions in GoReleaser's Quick Start (jump to the section starting "You’ll need to export a GITHUB_TOKEN environment variable").


