| asserts | The asserts group reports the number of asserts on the database. While assert errors are typically uncommon, if there are non-zero values for the asserts, you should check the log file for the mongod process for more information. In many cases these errors are trivial, but are worth investigating. |
| durability | The durability group contains data regarding the mongod's journaling-related operations and performance. mongod must be running with journaling for these data to appear in the output of "serverStatus". |
| background_flushing | mongod periodically flushes writes to disk. In the default configuration, this happens every 60 seconds. The background_flushing group contains data regarding these operations. Consider these values if you have concerns about write performance and journaling. |
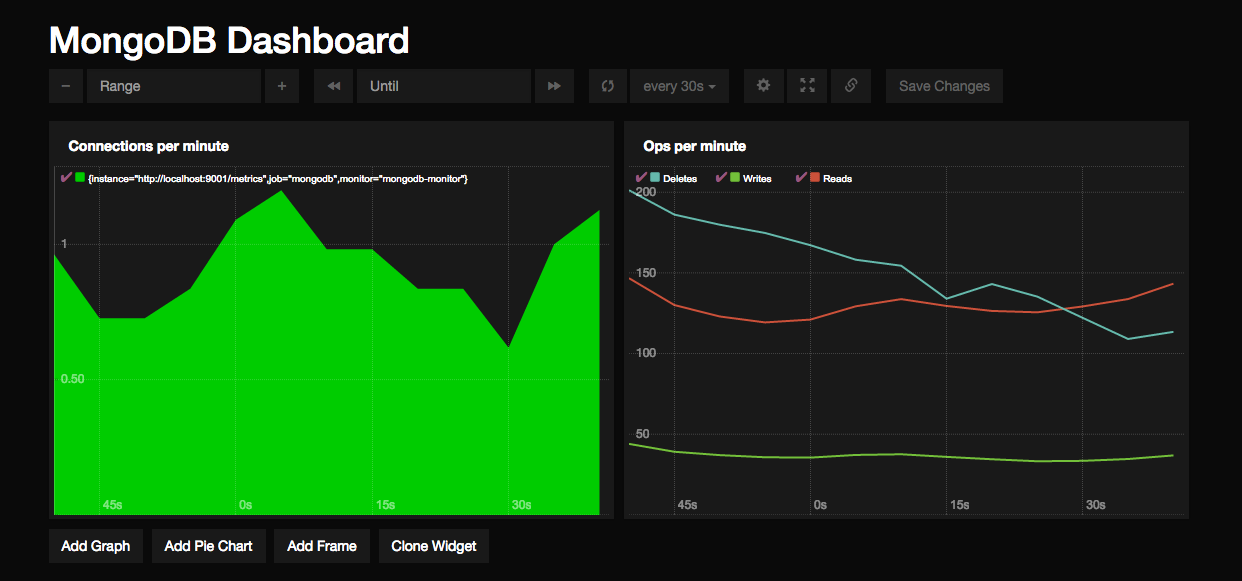
| connections | The connections groups contains data regarding the current status of incoming connections and availability of the database server. Use these values to assess the current load and capacity requirements of the server. |
| extra_info | The extra_info group holds data collected by the mongod instance about the underlying system. Your system may only report a subset of these fields. |
| global_lock | The global_lock group contains information regarding the database’s current lock state, historical lock status, current operation queue, and the number of active clients. |
| index_counters | The index_counters groupp reports information regarding the state and use of indexes in MongoDB. |
| network | The network group contains data regarding MongoDB’s network use. |
| op_counters | The op_counters group provides an overview of database operations by type and makes it possible to analyze the load on the database in more granular manner. These numbers will grow over time and in response to database use. Analyze these values over time to track database utilization. |
| op_counters_repl | The op_counters_repl group, similar to the op_counters data structure, provides an overview of database replication operations by type and makes it possible to analyze the load on the replica in more granular manner. These values only appear when the current host has replication enabled. These values will differ from the opcounters values because of how MongoDB serializes operations during replication. These numbers will grow over time in response to database use. Analyze these values over time to track database utilization. |
| memory | The memory group holds information regarding the target system architecture of mongod and current memory use |
| locks | The locks group containsdata that provides a granular report on MongoDB database-level lock use |
| metrics | The metrics group holds a number of statistics that reflect the current use and state of a running mongod instance. |
| cursors | The cursors group contains data regarding cursor state and use. This group is disabled by default because it is deprecated in mongodb >= 2.6. |


