Research
Security News
Malicious npm Package Targets Solana Developers and Hijacks Funds
A malicious npm package targets Solana developers, rerouting funds in 2% of transactions to a hardcoded address.
github.com/google/dtracestackstopprof
This is a tool used to convert performance profiles collected from DTrace to pprof, enabling graphical representation of the frequency of occuring stacks.
First clone the repo,
$ git clone https://github.com/google/dtraceStacksToPprof.git
The tool requires Go, which can be downloaded at the Go homepage
dtraceStacksToPprof can be installed to the GOPATH using
go install github.com/google/dtraceStacksToPprof
or run directly in the repo using
go run main.go
The converter supports stack output produced by DTrace, in the following pseudo BNF syntax:
  <input> ::= <prologue> <stacks>
  <prologue> = { JUNK_LINE }
  <stacks> ::= { <stack> }
  <stack> ::= STACK_HEADER <frames> COUNT
  <frames> ::= { <frame> }
  <frame> ::= HEX_ADDRESS | FUNCTION
  JUNK_LINE ::= (string not matching STACK_HEADER)
  STACK_HEADER ::= ^\s*[\S\s]+\s*:$  (a sentence ending with a colon, optionally
                                      surrounded by white space)
  COUNT ::= ^\s*[0-9]+\s*$  (a sole decimal digit, optionally surrounded by
                             white space)
  HEX_ADDRESS ::= ^\s*0x[0-9a-fA-F]+\s*$ (a hexadecimal address, optionally
                                          surrounded by white space)
  FUNCTION ::= ^\s*[\S]+`.*\+?\S*$ (non-whitespace, backtick, non-whitespace,
                                    followed by an optional plus sign and
                                    optional non-whitespace after, all
                                    optionally surrounded by white space)
It's designed to take the output of dtrace scripts like the following:
#!/bin/dtrace -s
syscall:::entry {
  @aggr["Label:", ustack()] = count();
}
tick-1s {
  printa(@aggr);
}
The dtraceStacksToPprof tool reads text from stdin and produces a pprof
protobuf. To produce a pprof directly from dtrace, simply pipe dtrace's output
into dtraceStacksToPprof like
$ sudo dtrace -s <script name> -p <target pid> | dtraceStacksToPprof
or store to an intermediate text file and then convert.
$ dtraceStacksToPprof < <intermediate file>
The tool writes to profile.pb.gz by default, but the output file name can be
customized via the --output command line flag:
$ dtraceStacksToPprof --output InterestingBehavior.pb.gz < <intermediate file>
This is not an officially supported Google product.
FAQs
Unknown package
Did you know?

Socket for GitHub automatically highlights issues in each pull request and monitors the health of all your open source dependencies. Discover the contents of your packages and block harmful activity before you install or update your dependencies.

Research
Security News
A malicious npm package targets Solana developers, rerouting funds in 2% of transactions to a hardcoded address.

Security News
Research
Socket researchers have discovered malicious npm packages targeting crypto developers, stealing credentials and wallet data using spyware delivered through typosquats of popular cryptographic libraries.

Security News
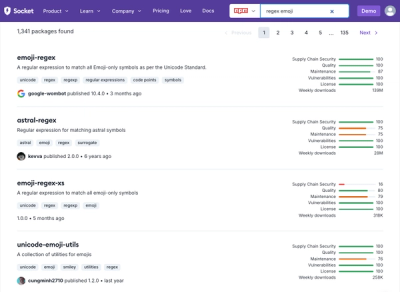
Socket's package search now displays weekly downloads for npm packages, helping developers quickly assess popularity and make more informed decisions.