Security News
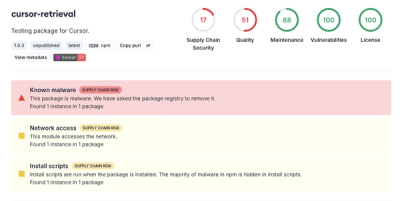
The Risks of Misguided Research in Supply Chain Security
Snyk's use of malicious npm packages for research raises ethical concerns, highlighting risks in public deployment, data exfiltration, and unauthorized testing.
github.com/uber/go-torch
As of Go 1.11, flamegraph visualizations are available in go tool pprof directly!
# This will listen on :8081 and open a browser.
# Change :8081 to a port of your choice.
$ go tool pprof -http=":8081" [binary] [profile]
If you cannot use Go 1.11, you can get the latest pprof tool and use it instead:
# Get the pprof tool directly
$ go get -u github.com/google/pprof

$ pprof -http=":8081" [binary] [profile]
Tool for stochastically profiling Go programs. Collects stack traces and synthesizes them into a flame graph. Uses Go's built in pprof library.
$ go-torch -h
Usage:
  go-torch [options] [binary] <profile source>

pprof Options:
  -u, --url=         Base URL of your Go program (default: http://localhost:8080)
  -s, --suffix=      URL path of pprof profile (default: /debug/pprof/profile)
  -b, --binaryinput= File path of previously saved binary profile. (binary profile is anything accepted by https://golang.org/cmd/pprof)
      --binaryname=  File path of the binary that the binaryinput is for, used for pprof inputs
  -t, --seconds=     Number of seconds to profile for (default: 30)
      --pprofArgs=   Extra arguments for pprof

Output Options:
  -f, --file=        Output file name (must be .svg) (default: torch.svg)
  -p, --print        Print the generated svg to stdout instead of writing to file
  -r, --raw          Print the raw call graph output to stdout instead of creating a flame graph; use with Brendan Gregg's flame graph perl script (see https://github.com/brendangregg/FlameGraph)
      --title=       Graph title to display in the output file (default: Flame Graph)
      --width=       Generated graph width (default: 1200)
      --hash         Colors are keyed by function name hash
      --colors=      Set color palette. Valid choices are: hot (default), mem, io, wakeup, chain, java,
                     js, perl, red, green, blue, aqua, yellow, purple, orange
      --hash         Graph colors are keyed by function name hash
      --cp           Graph use consistent palette (palette.map)
      --inverted     Icicle graph
Help Options:
  -h, --help         Show this help message
The default options will hit http://localhost:8080/debug/pprof/profile for
a 30 second CPU profile, and write it out to torch.svg
$ go-torch
INFO[19:10:58] Run pprof command: go tool pprof -raw -seconds 30 http://localhost:8080/debug/pprof/profile
INFO[19:11:03] Writing svg to torch.svg
You can customize the base URL by using -u
$ go-torch -u http://my-service:8080/
INFO[19:10:58] Run pprof command: go tool pprof -raw -seconds 30 http://my-service:8080/debug/pprof/profile
INFO[19:11:03] Writing svg to torch.svg
Or change the number of seconds to profile using --seconds:
$ go-torch --seconds 5
INFO[19:10:58] Run pprof command: go tool pprof -raw -seconds 5 http://localhost:8080/debug/pprof/profile
INFO[19:11:03] Writing svg to torch.svg
go-torch will pass through arguments to go tool pprof, which lets you take
existing pprof commands and easily make them work with go-torch.
For example, after creating a CPU profile from a benchmark:
$ go test -bench . -cpuprofile=cpu.prof

# This creates a cpu.prof file, and the $PKG.test binary.
The same arguments that can be used with go tool pprof will also work
with go-torch:
$ go tool pprof main.test cpu.prof

# Same arguments work with go-torch
$ go-torch main.test cpu.prof
INFO[19:00:29] Run pprof command: go tool pprof -raw -seconds 30 main.test cpu.prof
INFO[19:00:29] Writing svg to torch.svg
Flags that are not handled by go-torch are passed through as well:
$ go-torch --alloc_objects main.test mem.prof
INFO[19:00:29] Run pprof command: go tool pprof -raw -seconds 30 --alloc_objects main.test mem.prof
INFO[19:00:29] Writing svg to torch.svg
To add profiling endpoints in your application, follow the official Go docs here. If your application is already running a server on the DefaultServeMux, just add this import to your application.
import _ "net/http/pprof"
If your application is not using the DefaultServeMux, you can still easily expose pprof endpoints by manually registering the net/http/pprof handlers or by using a library like this one.
$ go get github.com/uber/go-torch
You can also use go-torch using docker:
$ docker run uber/go-torch -u http://[address-of-host] -p > torch.svg
Using -p will print the SVG to standard out, which can then be redirected
to a file. This avoids mounting volumes to a container.
When using the go-torch binary locally, you will need the Flamegraph scripts
in your PATH:
$ cd $GOPATH/src/github.com/uber/go-torch
$ git clone https://github.com/brendangregg/FlameGraph.git
$ go get github.com/Masterminds/glide
$ cd $GOPATH/src/github.com/uber/go-torch
$ glide install
$ go test ./...
ok    github.com/uber/go-torch   0.012s
ok    github.com/uber/go-torch/graph   0.017s
ok    github.com/uber/go-torch/visualization 0.052s
FAQs
Unknown package
Did you know?

Socket for GitHub automatically highlights issues in each pull request and monitors the health of all your open source dependencies. Discover the contents of your packages and block harmful activity before you install or update your dependencies.

Security News
Snyk's use of malicious npm packages for research raises ethical concerns, highlighting risks in public deployment, data exfiltration, and unauthorized testing.

Research
Security News
Socket researchers found several malicious npm packages typosquatting Chalk and Chokidar, targeting Node.js developers with kill switches and data theft.

Security News
pnpm 10 blocks lifecycle scripts by default to improve security, addressing supply chain attack risks but sparking debate over compatibility and workflow changes.