Yardstick - Benchmarking Framework
Yardstick is a framework for writing benchmarks. Specifically it helps with writing benchmarks for clustered or otherwise distributed systems.
The framework comes with a default set of probes that collect various metrics during benchmark execution. Probes can be turned on or off in configuration. You can use a probe for measuring throughput and latency, or a probe that gathers vmstat statistics, etc... At the end of benchmark execution, Yardstick automatically produces files with probe points.
GridGain Benchmarks On Yardstick
See Yardstick GridGain Benchmarks as an example of Yardstick framework usage.
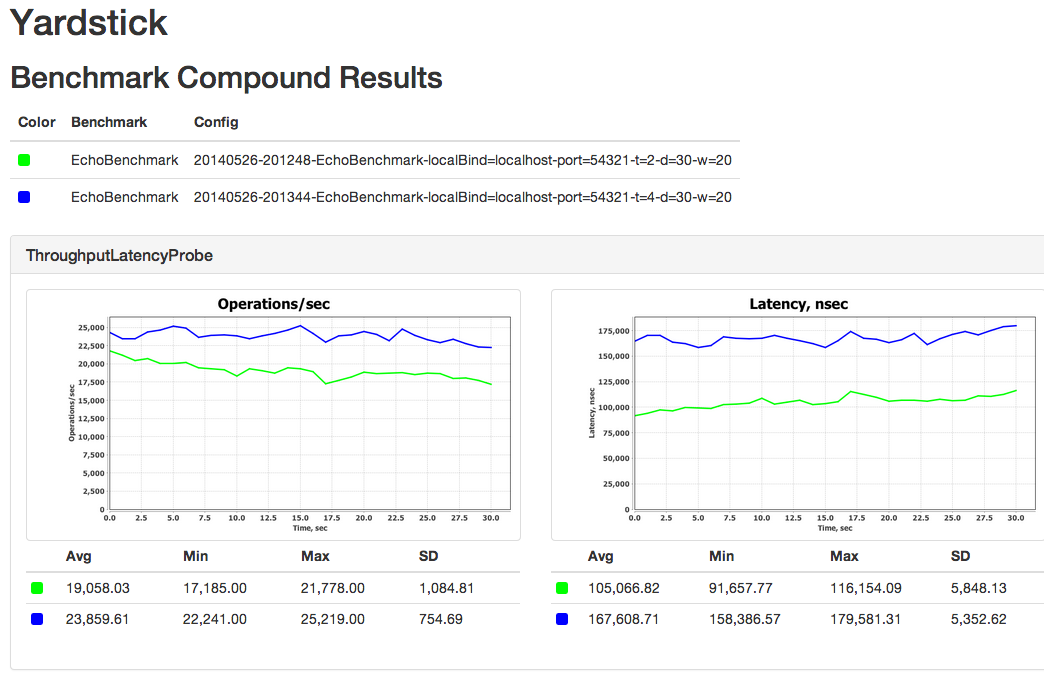
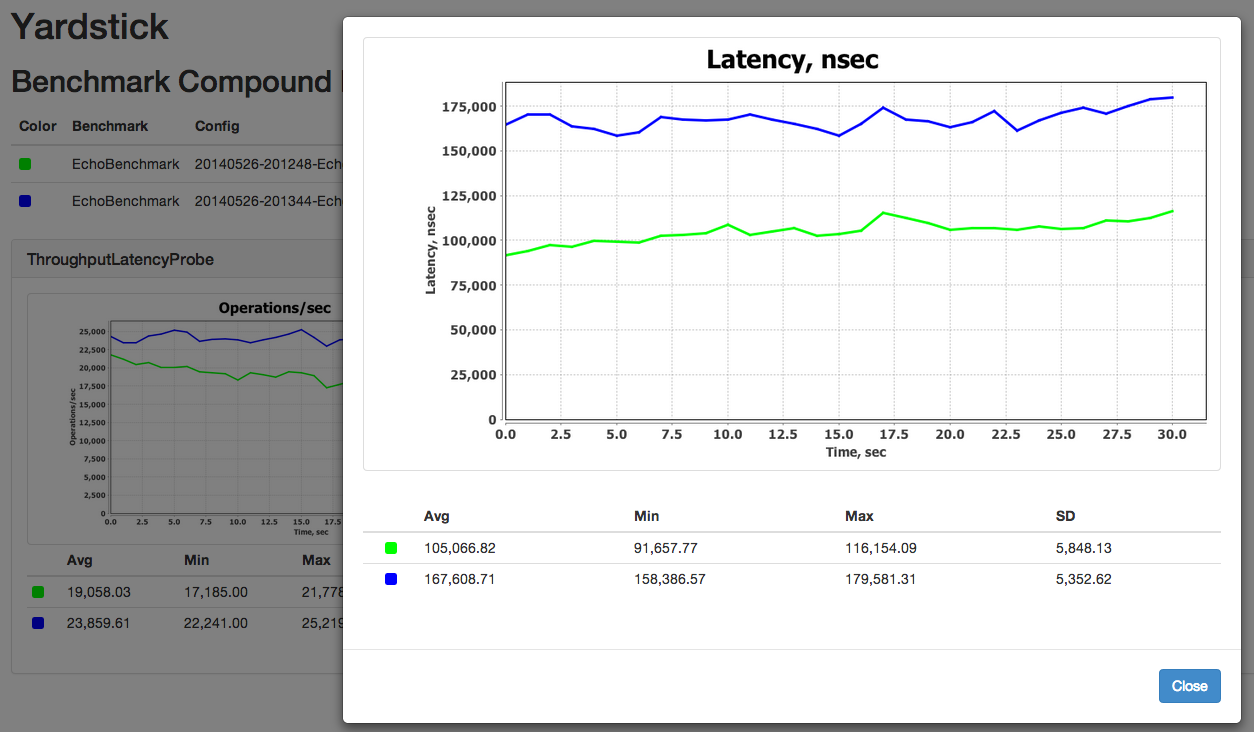
Screenshots

Click on individual graphs to Zoom In

Available Probes
ThroughputLatencyProbe - measures throughput and latencyDStatProbe - collects information provided by Linux/Unix ‘dstat’ command, such as various network, CPU, or memory metricsVmStatProbe - collects information provided by Linux/Unix ‘vmstat’ command (which is a subset of ‘dstat’ command), such as various network, CPU, or memory metricsPercentileProbe - tracks the latency of each individual request and collects the time frame bucket
Creating Yardstick Benchmarks
There are two main interfaces that need to be implemented, BenchmarkServer and BenchmarkDriver:
BenchmarkDriver is an instance of the benchmark that performs some operation that needs to be tested.BenchmarkServer is the remote server that the BenchmarkDriver communicates with.
You can benchmark any distributed operation with Yardstick. For example, if you have to measure message processing time in your application, then you can put message sending logic into BenchmarkDriver, and message processing logic to one or more remote BenchmarkServers.
It is as simple as this. Yardstick will measure throughput, latency, and other metrics for you automatically and produce nice graphs at the end.
Examples
You can find Yardstick benchmark examples in
Running Yardstick Benchmarks
The easiest way to run benchmarks is by executing bin/benchmark-run-all.sh script which will automatically start benchmark driver and remote servers base based on the properties file passed in (config/benchmark.properties used by default):
$ bin/benchmark-run-all.sh config/benchmark.properties
This script will automatically restart benchmark driver and remote servers for every benchmark configuration provided in config/benchmark.properties file.
At the end of the run, you can generate graphs by executing bin/jfreechart-graph-gen.sh script with folders that contain benchmark results.
$ bin/jfreechart-graph-gen.sh -i results_2014-05-16_00-28-01 results_2014-05-15_18-38-14
Starting Remote Servers
If you do not wish to run bin/benchmark-run-all.sh script and prefer to have more control over starting and stopping remote servers, you can use benchmark-servers-start.sh script directly.
$ bin/benchmark-servers-start.sh config/benchmark.properties
Server Log Files are stored in the logs-<current time>/logs_servers folder.
Starting Benchmark Driver
Again, if you do not wish to run bin/benchmark-run-all.sh script, you can start benchmark driver directly by executing benchmark-driver-start.sh script.
$ bin/benchmark-driver-start.sh config/benchmark.properties
Driver Log Files are stored in the logs-<current time>/logs_drivers folder.
Stopping Remote Servers
To stop remote servers after the benchmark is finished, you can execute benchmark-servers-stop.sh script.
$ bin/benchmark-servers-stop.sh config/benchmark.properties
Manual Running
There are scripts that allow to run servers and drivers on local machine only, no SSH commands are used to start remote servers or drivers.
To start servers you can execute benchmark-manual-servers-start.sh script. Optionally the number of servers parameter can be passed to this script.
If it's not specified then the number of servers will be equal to the number of server hosts (SERVER_HOSTS property in properties file).
$ bin/benchmark-manual-servers-start.sh config/benchmark.properties
To start drivers you can execute benchmark-manual-drivers-start.sh script.
$ bin/benchmark-manual-drivers-start.sh config/benchmark.properties
Servers and drivers are stopped manually, for example by kill command.
Windows version of manual scripts is shipped as well: benchmark-manual-servers-start.bat and benchmark-manual-drivers-start.bat batch scripts.
Properties And Command Line Arguments
The following properties can be defined in benchmark properties file:
BENCHMARK_DEFAULT_PROBES - list of default probesBENCHMARK_PACKAGES - packages where the specified benchmark is searched by reflection mechanismBENCHMARK_WRITER - probe point writer class name (by default CSV writer is used)SERVER_HOSTS - comma-separated list of IP addresses where servers should be started, one server per hostDRIVER_HOSTS - comma-separated list of IP addresses where drivers should be started, one driver per host, if the property is not defined then the driver will be run on localhostREMOTE_USER - SSH user for logging in to remote hostsJVM_OPTS - list of general JVM options used to start both server and driver nodeSERVER_JVM_OPTS - list of JVM options used to start server node (appended to JVM_OPTS)DRIVER_JVM_OPTS - list of JVM options used to start driver node (appended to JVM_OPTS)RESTART_SERVERS - there is two modes to use it. 1. RESTART_SERVERS=true - yardstick will start new servers
for each benchmark. 2. RESTART_SERVERS=<hostname_1>:<id_1>:<delay_1>:<pause_1>:<period_1>,<hostname_2>:<id_2>:<delay_2>:<pause_2>:<period_2> -
comma-separated list of colon-separated tuples of a hostname,
a server host id (id - number of hostname at SERVER_HOSTS from 0),
a delay (for warmup) before first restart (stop, then pause, then start),
the pause time (pause between server kill and server start)
and a period for next restarts.
The delay, the pause and the period in seconds (Note: it can be 0.1 seconds for example).
Please pay attention that restarters warmup delay is an absolute time from benchmark start, it does not depends of benchmark's warmup delay.
In this case, yardstick will start new servers for each benchmark (the same with RESTART_SERVERS=true), and after starting of driver,
yardstick will killing server by the hostname according to the delay, the pause and the period time.CONFIGS - comma-separated list of benchmark run configurations which are passed to the servers and to the benchmarks
Example of benchmark.properties file to run 2 instances of EchoServer
# List of default probes.
BENCHMARK_DEFAULT_PROBES=ThroughputLatencyProbe

# Packages where the specified benchmark is searched by reflection mechanism.
BENCHMARK_PACKAGES=org.yardstick

# Probe point writer class name.
# BENCHMARK_WRITER=

# General JVM options.
JVM_OPTS=${JVM_OPTS}"-Xms512m"

# Server JVM options.
SERVER_JVM_OPTS=${SERVER_JVM_OPTS}"-Xmx512m"

# Driver JVM options.
DRIVER_JVM_OPTS=${DRIVER_JVM_OPTS}"-Xmx1024m"


# Comma-separated list of remote hosts to run BenchmarkServers on.
# If same host is specified multiple times, then benchmark server will be started on that host multiple times.
SERVER_HOSTS=localhost,localhost

# Comma-separated list of remote hosts to run BenchmarkDrivers on.
# If same host is specified multiple times, then benchmark driver will be started on that host multiple times.
DRIVER_HOSTS=localhost,localhost

# Remote username.
# REMOTE_USER=

# Comma-separated list of benchmark driver and server configuration parameters.
CONFIGS="\
--localBind localhost --duration 30 -t 2 -sn EchoServer -dn EchoBenchmark,\
--localBind localhost --duration 30 -t 4 -sn EchoServer -dn EchoBenchmark\
"
The following properties can be defined in the benchmark configuration:
-cfg <path> or --config <path> - framework configuration file path-dn <list> or --driverNames <list> - space-separated list of driver names (required for the driver), the specified drivers will be run in one JVM,
optionally a weight can be added to the driver name, for example EchoBenchmark:3 NewEchoBenchmark:7,
so EchoBenchmark will be run 30% of benchmark time, NewEchoBenchmark will be run 70%-sn <name> or --serverName <name> - server name (required for the server)-p <list> or --packages <list> - comma separated list of packages for benchmarks-pr <list> or --probes <list> - comma separated list of probes for benchmarks-wr <name> or --writer <name> - probe point writer class name-t <num> or --threads <num> - thread count (set to 'cpus * 2')-d <time> or --duration <time> - test duration, in seconds-w <time> or --warmup <time> - warmup time, in seconds-sh or --shutdown - flag indicating whether to invoke shutdown hook or not-of <path> or --outputFolder <path> - output folder for benchmark results, current folder is used by default-ds <list> or --descriptions <list> - space-separated list of benchmark run descriptions,
the description with index 1 corresponds to the driver with index 1 and so on-hn <name> or --hostName <name> - host name where a benchmark driver is run, this property is set automatically by the benchmark scripts
For example if we need to run EchoServer server on localhost and EchoServerBenchmark benchmark on localhost,
the test should be 20 seconds then the following configuration should be specified in run properties file:
SERVER_HOSTS=localhostCONFIGS="--duration 20 -sn EchoServer -dn EchoServerBenchmark"
JFreeChart Graphs
Yardstick goes with the script jfreechart-graph-gen.sh that builds JFreeChart graphs using probe points.
jfreechart-graph-gen.sh script accepts the following arguments:
-i <list> or --inputFolders <list> - space separated list of input folders which contains folders
with probe results files (required)-cc <num> or --chartColumns <num> - number of columns that the charts are displayed in on the resulted page-gm <mode> or --generationMode <mode> - mode that defines the way how different benchmark runs are compared
with each other-sm <mode> or --summaryMode <mode> - mode that defines whether a summary plot is added to a graph or not.
It's useful to add summary plots when two or more drivers are run in one JVM (driver names that defined via --driverNames configuration property)
or when two or more drivers are run on multiple hosts (DRIVER_HOSTS property in properties file).
In these cases the plots of ThroughputLatencyProbe or PercentileProbe probes from multiple drivers can be replaced with one summary plot.
Generation modes:
STANDARD - All benchmark results are displayed on separate graphs. Graphs are generated in the benchmark run folder.
bin/jfreechart-graph-gen.sh -gm STANDARD -i results_2014-05-20_03-19-21
COMPARISON - Benchmarks from multiple folders are paired together. In this mode 2 or more results folders are compared in such way that benchmark 1 from result 1 will be compared with benchmark 1 from result 2, same for benchmark 2, 3 and so on.
bin/jfreechart-graph-gen.sh -gm COMPARISON -i results_2014-05-20_03-19-21 results_2014-05-20_03-20-35
COMPOUND - Benchmarks from multiple folders (space separated) are shown together on the same graph. This is default mode.
bin/jfreechart-graph-gen.sh -gm COMPOUND -i results_2014-05-20_03-19-21 results_2014-05-20_03-20-35
Summary modes:
SUM_ONLY - Summary plot is added to a graph. This is default mode.
bin/jfreechart-graph-gen.sh -sm SUM_ONLY -i results_2014-05-20_03-19-21
INDIVIDUAL_ONLY - Individual plots are displayed.
bin/jfreechart-graph-gen.sh -sm INDIVIDUAL_ONLY -i results_2014-05-20_03-19-21 results_2014-05-20_03-20-35
INDIVIDUAL_AND_SUM - Individual and summary plots are displayed.
bin/jfreechart-graph-gen.sh -sm INDIVIDUAL_AND_SUM -i results_2014-05-20_03-19-21 results_2014-05-20_03-20-35
Maven Install
The easiest way to get started with Yardstick in your project is to use Maven dependency management:
<dependency>
    <groupId>org.yardstick</groupId>
    <artifactId>yardstick</artifactId>
    <version>RELEASE</version>
</dependency>
Yardstick is shipped with scripts that run servers and drivers, these scripts can be used for your benchmarks. In order to have them, just unzip yardstick-resources.zip maven artifact. Also this can be done by copying and pasting the following code snippet to your benchmark project POM file (see how it's done in
Yardstick GridGain).
<build>
    <plugins>
        <plugin>
            <artifactId>maven-dependency-plugin</artifactId>
            <executions>
                <execution>
                    <id>unpack</id>
                    <phase>package</phase>
                    <goals>
                        <goal>unpack</goal>
                    </goals>
                    <configuration>
                        <artifactItems>
                            <artifactItem>
                                <groupId>org.yardstick</groupId>
                                <artifactId>yardstick</artifactId>
                                <version>RELEASE</version>
                                <type>zip</type>
                                <classifier>resources</classifier>
                                <outputDirectory>${basedir}</outputDirectory>
                            </artifactItem>
                        </artifactItems>
                    </configuration>
                </execution>
            </executions>
        </plugin>
    </plugins>
</build>
Issues
Use GitHub issues to file bugs.
License
Yardstick is available under Apache 2.0 Open Source license.


