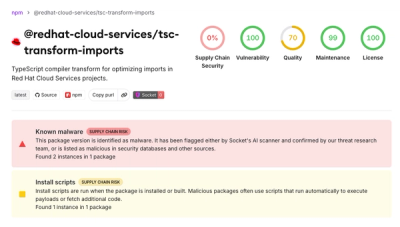
📊 @backtest-kit/ui
Full-stack UI framework for visualizing cryptocurrency trading signals, backtests, and real-time market data. Combines a Node.js backend server with a React dashboard - all in one package.


Interactive dashboard for backtest-kit with signal visualization, candle charts, risk analysis, and notification management. Built with React 18, Material-UI, and Lightweight Charts.
📚 Backtest Kit Docs | 🌟 GitHub
New to backtest-kit? The fastest way to get a real, production-ready setup is to clone the reference implementation — a fully working news-sentiment AI trading system with LLM forecasting, multi-timeframe data, and a documented February 2026 backtest. Start there instead of from scratch.
✨ Features
- 📈 Interactive Charts: Candlestick visualization with Lightweight Charts (1m, 15m, 1h timeframes)
- 🎯 Signal Tracking: View opened, closed, scheduled, and cancelled signals with full details
- 📊 Risk Analysis: Monitor risk rejections and position management
- 🔔 Notifications: Real-time notification system for all trading events
- 💹 Trailing & Breakeven: Visualize trailing stop/take and breakeven events
- 🌐 Multi-Exchange: Support for 100+ exchanges via CCXT integration
- 🎨 Material Design: Beautiful UI with MUI 5 and Mantine components
- 🌍 i18n Ready: Internationalization support built-in
📋 What It Does
@backtest-kit/ui provides both backend API and frontend dashboard:
serve() | Start HTTP server with REST API endpoints |
getRouter() | Get expressjs-compatible router for custom middleware integration |
🚀 Installation
npm install @backtest-kit/ui backtest-kit ccxt
📖 Usage
Quick Start - Launch Dashboard
import { serve } from '@backtest-kit/ui';
serve('0.0.0.0', 60050);
Custom Logger Integration
import { setLogger } from '@backtest-kit/ui';

setLogger({
  log: (msg) => console.log(`[UI] ${msg}`),
  warn: (msg) => console.warn(`[UI] ${msg}`),
  error: (msg) => console.error(`[UI] ${msg}`),
});
📐 Dashboard Revenue Math
The Revenue metrics on the dashboard are calculated in dollar terms by summing the pnlCost field from all closed signals within each time window.
Dollar PnL formula
revenue[window] = Σ signal.pnl.pnlCost (for all closed signals in that window)
pnlCost is computed by the backend (toProfitLossDto) as:
pnlCost = (pnlPercentage / 100) × pnlEntries
pnl.pnlCost | IStorageSignalRow | Absolute P&L in USD — the only value summed for revenue |
pnl.pnlPercentage | IStorageSignalRow | Percentage P&L (accounts for DCA-weighted entry price, slippage, and fees) |
pnl.pnlEntries | IStorageSignalRow | Total invested capital in USD — sum of all entry costs (Σ entry.cost) |
Example (1 DCA entry at $100, position closed +5%):
| 1 | $100 | 5 % | +$5.00 |
| 2 | $200 | 5 % | +$10.00 |
| 3 | $300 | 5 % | +$15.00 |
Time windows
The anchor point depends on execution mode:
- Backtest mode — latest
updatedAt across all closed signals (time windows are relative to the end of the run)
- Live mode —
Date.now() (wall-clock time)
| Today | >= startOf(anchorDay) |
| Yesterday | [anchorDay − 1d, anchorDay) |
| 7 days | >= anchorDay − 7d |
| 31 days | >= anchorDay − 31d |
Revenue and signal count are tracked separately for each window and aggregated across all symbols on the Dashboard.
📐 Position PNL Math
Effective entry price (DCA-weighted)
When multiple DCA entries exist, the effective open price is a cost-weighted harmonic mean:
effectivePrice = Σcost / Σ(cost / price)
This is the correct formula for fixed-dollar entries (not simple average), because buying $100 worth at different prices gives different coin quantities.
Partial closes (PP/PL)
Each partial stores a costBasisAtClose snapshot — the running dollar cost-basis before that partial fired. This avoids replaying the full entry history on every call.
Cost-basis replay:
for each partial[i]:
    closedDollar      += (percent[i] / 100) × costBasisAtClose[i]
    remainingCostBasis = costBasisAtClose[i] × (1 - percent[i] / 100)

# DCA entries added AFTER the last partial are appended:
remainingCostBasis += Σ entry.cost for entries[lastEntryCount..]

totalClosedPercent = closedDollar / totalInvested × 100
Effective price through partials is computed iteratively so that a partial sell does not change the entry price of the remaining coins:
# partial[0]:
  effPrice = costBasisAtClose[0] / Σ(cost/price for entries[0..cnt[0]])

# partial[j]:
  remainingCB = prev.costBasisAtClose × (1 - prev.percent / 100)
  oldCoins    = remainingCB / effPrice        ← coins still held
  newCoins    = Σ(cost/price for DCA entries between j-1 and j)
  effPrice    = (remainingCB + newCost) / (oldCoins + newCoins)
toProfitLossDto — weighted PNL with slippage & fees
Without partials:
priceOpenSlip  = effectivePrice × (1 ± slippage)
priceCloseSlip = priceClose     × (1 ∓ slippage)

pnlPercentage = (priceCloseSlip - priceOpenSlip) / priceOpenSlip × 100
fee           = CC_PERCENT_FEE × (1 + priceCloseSlip / priceOpenSlip)
pnlPercentage -= fee
With partials — dollar-weighted sum:
weight[i] = (percent[i] / 100 × costBasisAtClose[i]) / totalInvested

totalWeightedPnl = Σ weight[i] × pnl[i]           # each partial at its own effectivePrice
                 + remainingWeight × pnlRemaining   # rest closed at final priceClose

fee = CC_PERCENT_FEE                                              # open (once)
    + Σ CC_PERCENT_FEE × weight[i] × (closeSlip[i] / openSlip[i])  # per partial
    + CC_PERCENT_FEE × remainingWeight × (closeSlip / openSlip)     # final close

pnlPercentage = totalWeightedPnl - fee
pnlCost       = pnlPercentage / 100 × totalInvested
totalInvested | Σ entry.cost (or CC_POSITION_ENTRY_COST if no _entry) |
weight[i] | Real dollar share of each partial relative to totalInvested |
effectivePrice at partial i | Computed via iterative costBasisAtClose replay up to partials[i] |
priceOpen in result | getEffectivePriceOpen(signal) — DCA-weighted harmonic mean across all entries |
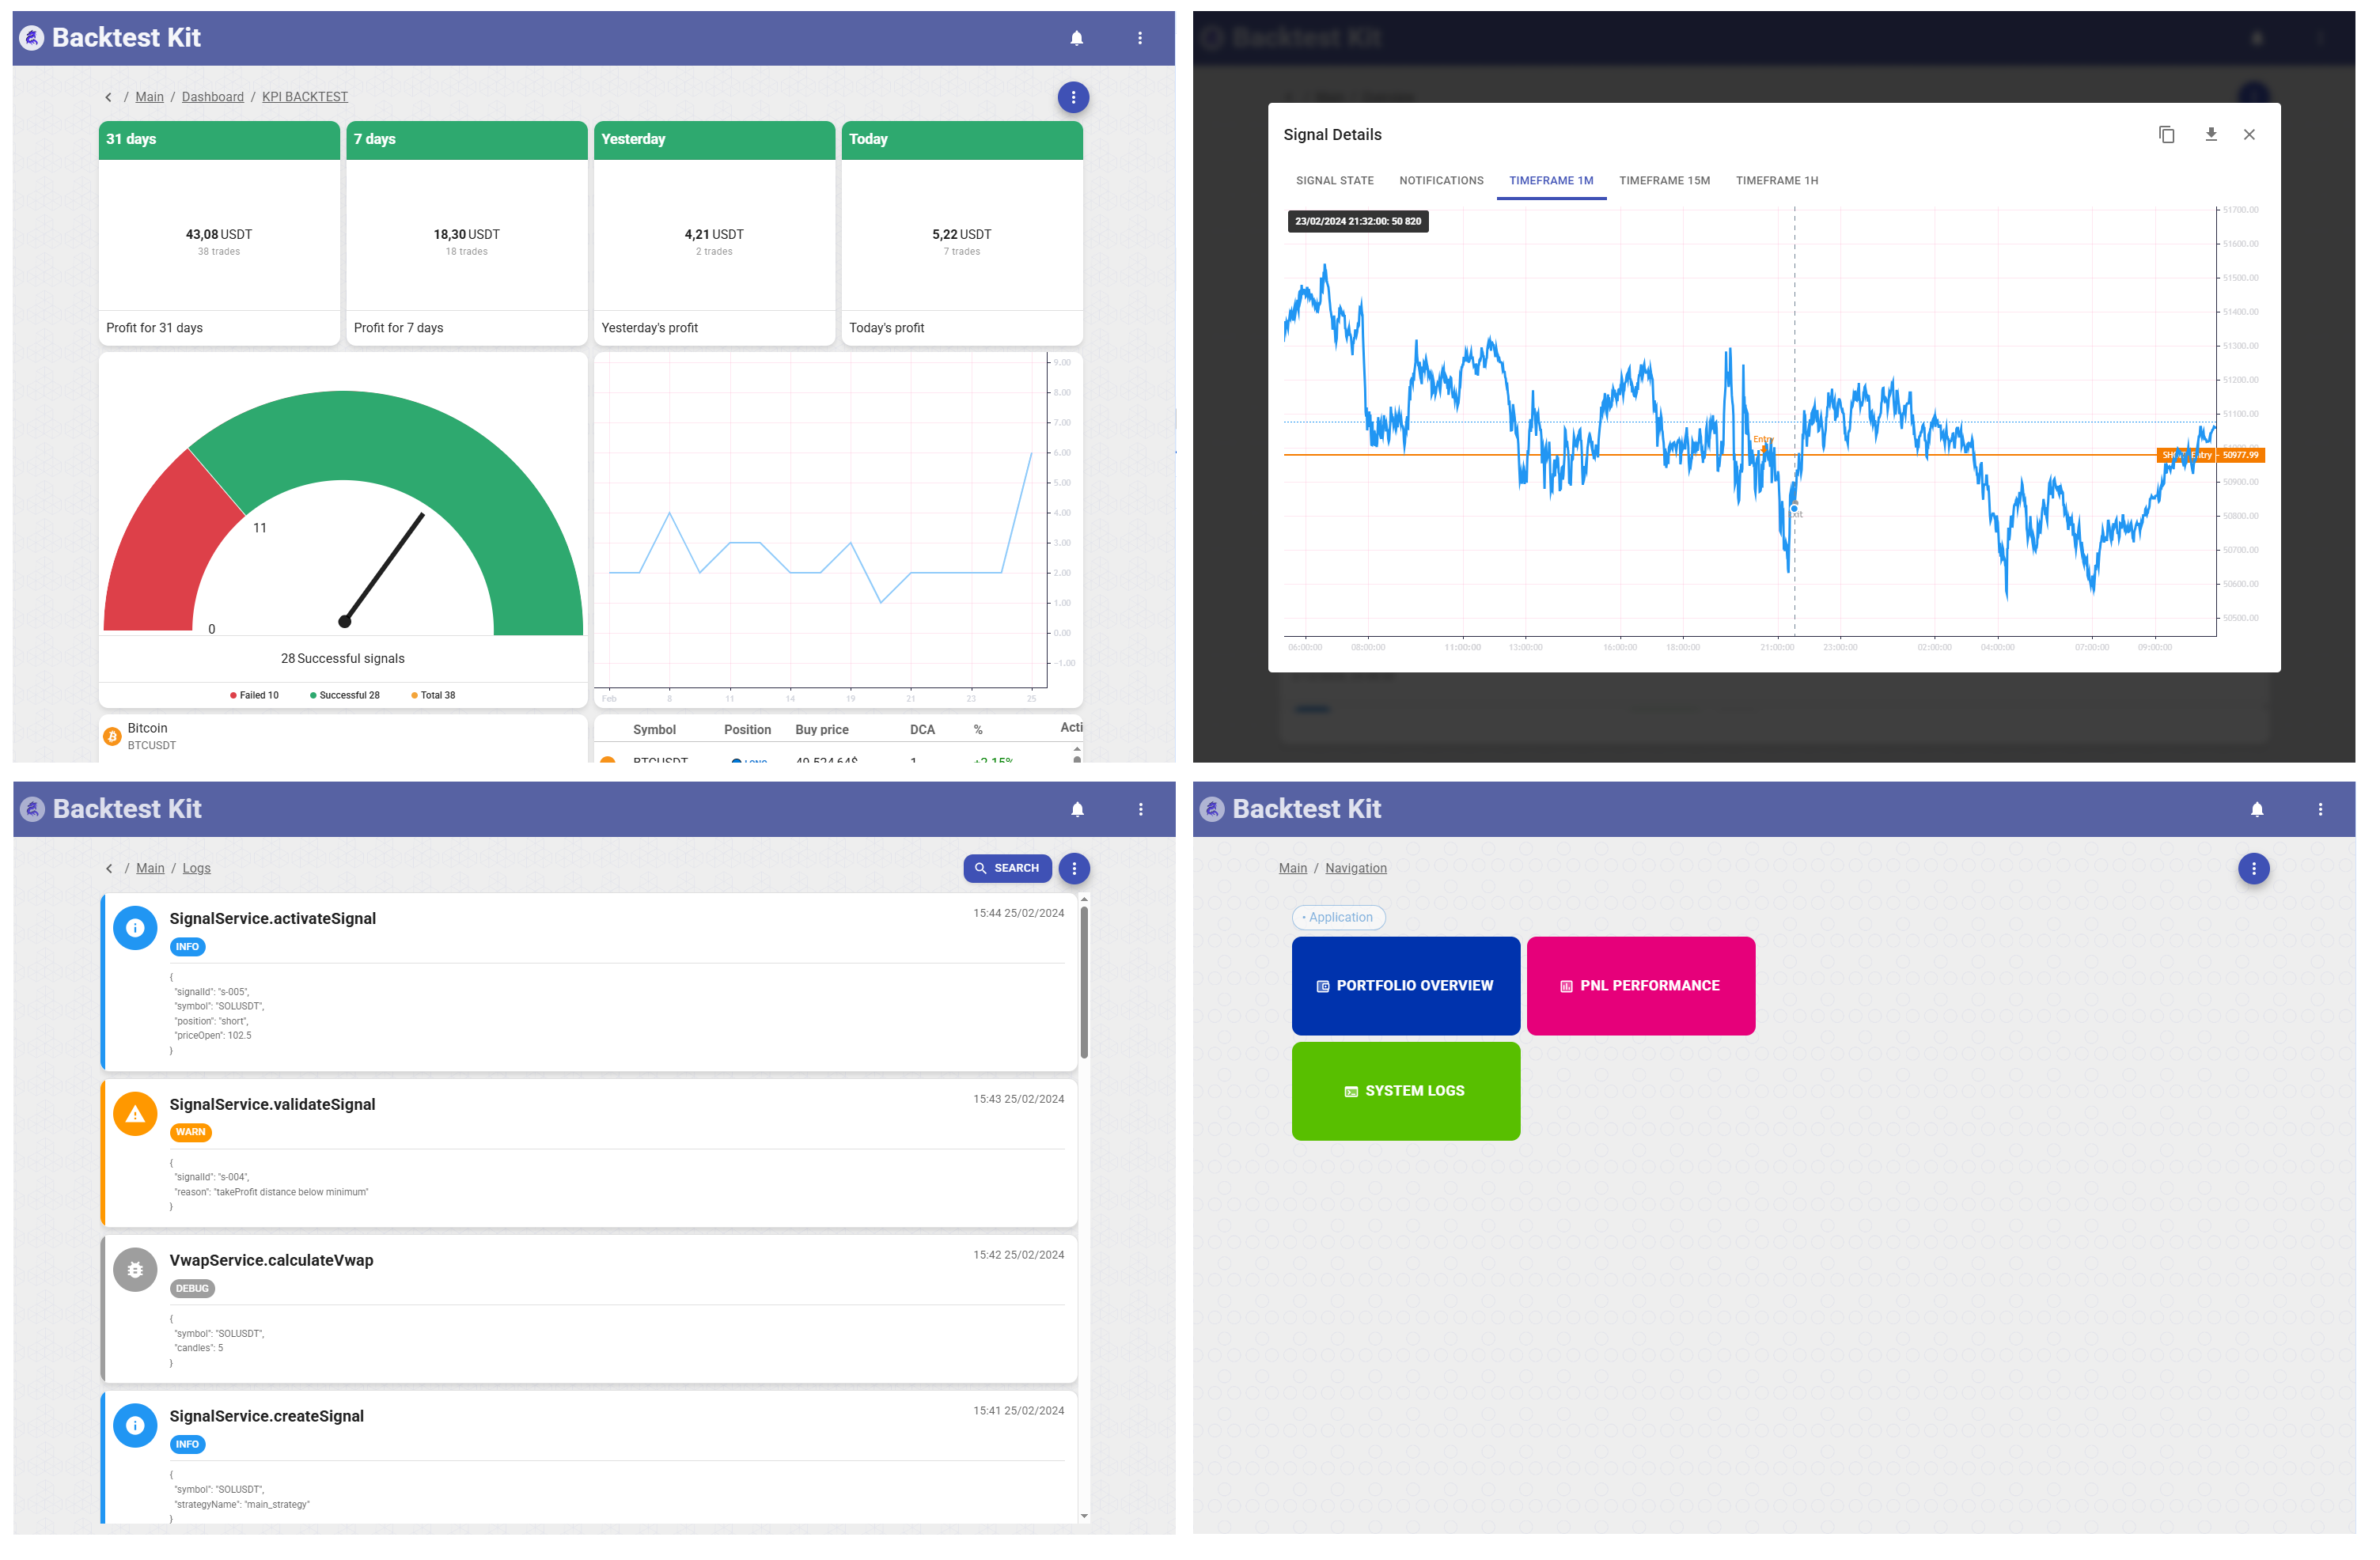
🖥️ Dashboard Views
The frontend provides specialized views for different trading events:
| Signal Opened | Entry details with chart visualization |
| Signal Closed | Exit details with PnL analysis |
| Signal Scheduled | Pending orders awaiting activation |
| Signal Cancelled | Cancelled orders with reasons |
| Risk Rejection | Signals rejected by risk management |
| Partial Profit/Loss | Partial position closures |
| Trailing Stop/Take | Trailing adjustments visualization |
| Breakeven | Breakeven level adjustments |
Each view includes:
- 📋 Detailed information form
- 📈 1m, 15m, 1h candlestick charts
- 📥 JSON export for all data
💡 Why Use @backtest-kit/ui?
Instead of building custom dashboards:
Without backtest-kit
With backtest-kit
import { serve } from '@backtest-kit/ui';
serve();
Benefits:
- 📊 Production-ready trading dashboard out of the box
- 📈 Professional chart visualization with price lines and markers
- 🔔 Complete notification system for all trading events
- 🎨 Beautiful Material Design interface
- ⚡ Fast development - focus on strategy, not UI
- 🛡️ Full TypeScript support
🤝 Contribute
Fork/PR on GitHub.
📜 License
MIT © tripolskypetr