CanvasJS jQuery StockCharts - Official
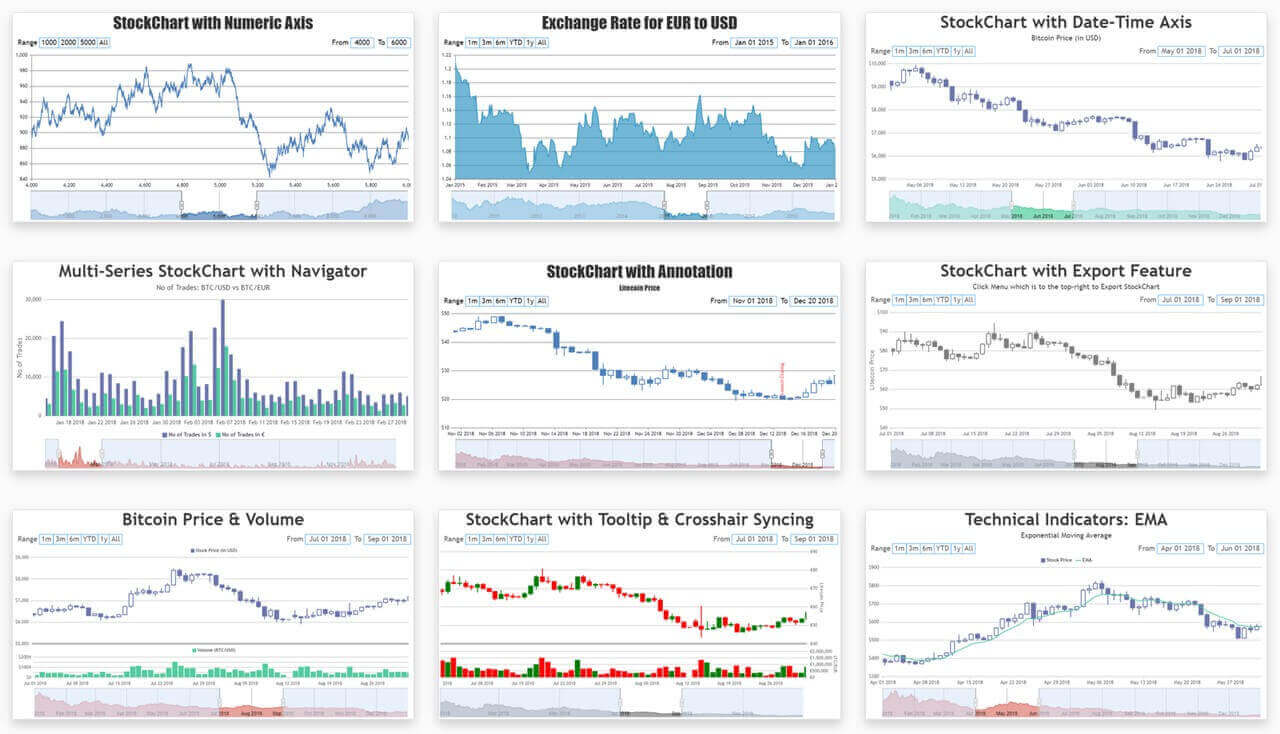
CanvasJS jQuery StockChart for creating interactive charts & graphs for your web pages. Library supports a wide range of chart types including line, area, column, candlestick, etc.
Important Links
Installing CanvasJS jQuery StockCharts
There are multiple ways to install CanvasJS jQuery StockCharts. You can directly add script-tag to include it from CDN or download it from official site or install it from NPM registry.
Install jQuery StockChart via NPM
npm install --save @canvasjs/jquery-stockcharts
See npm documentation to know more about npm usage.
Using CanvasJS jQuery StockCharts via CDN
You can access CanvasJS jQuery StockCharts from our CDN directly. The plugin has a dependency on jQuery, and hence that has to be imported as well.
<script src="https://cdnjs.cloudflare.com/ajax/libs/jquery/3.7.1/jquery.min.js"></script>
<script src="https://cdn.canvasjs.com/ga/jquery.canvasjs.stock.min.js"></script>
Download from Official Site
You can download the jQuery plugin along with examples from our official download page. Save it in your project directory & add it in your application.
<script src="https://cdnjs.cloudflare.com/ajax/libs/jquery/3.7.1/jquery.min.js"></script>
<script src="jquery.canvasjs.stock.min.js"></script>
Usage
After CanvasJS jQuery StockCharts is installed, it can be imported into your project.
//Load jQuery and CanvasJS jQuery StockCharts
import $ from "jquery";
import "@canvasjs/jquery-charts";
Define container for the StockChart.
<div id="stockChartContainer"></div>
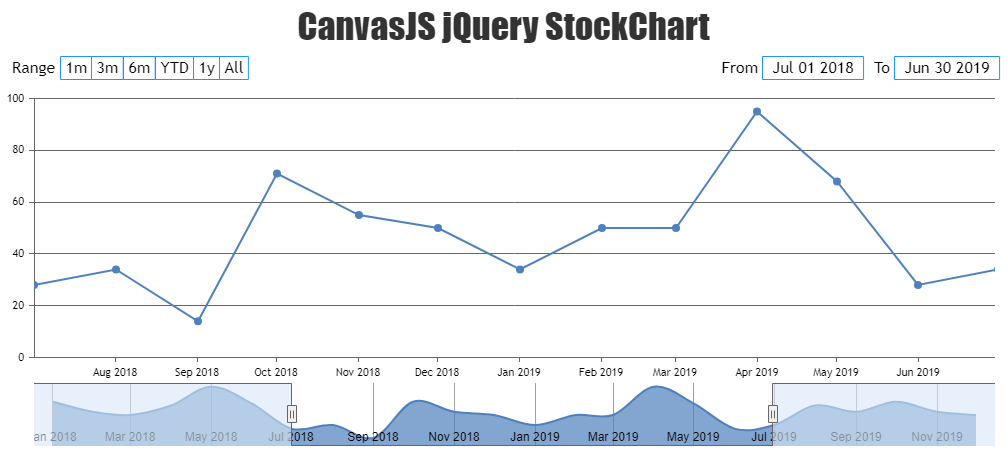
Create StockChart
    var stockChartOptions = {
        title: {
            text: "CanvasJS StockChart"
        },
        charts: [{
            data: [{
                type: "line",
                dataPoints: [
                    { x: new Date("2018-01-01"), y: 71 },
                    { x: new Date("2018-02-01"), y: 55 },
                    { x: new Date("2018-03-01"), y: 50 },
                    { x: new Date("2018-04-01"), y: 65 },
                    { x: new Date("2018-05-01"), y: 95 },
                    { x: new Date("2018-06-01"), y: 68 },
                    { x: new Date("2018-07-01"), y: 28 },
                    { x: new Date("2018-08-01"), y: 34 },
                    { x: new Date("2018-09-01"), y: 14 },
                    { x: new Date("2018-10-01"), y: 71 },
                    { x: new Date("2018-11-01"), y: 55 },
                    { x: new Date("2018-12-01"), y: 50 },
                    { x: new Date("2019-01-01"), y: 34 },
                    { x: new Date("2019-02-01"), y: 50 },
                    { x: new Date("2019-03-01"), y: 50 },
                    { x: new Date("2019-04-01"), y: 95 },
                    { x: new Date("2019-05-01"), y: 68 },
                    { x: new Date("2019-06-01"), y: 28 },
                    { x: new Date("2019-07-01"), y: 34 },
                    { x: new Date("2019-08-01"), y: 65 },
                    { x: new Date("2019-09-01"), y: 55 },
                    { x: new Date("2019-10-01"), y: 71 },
                    { x: new Date("2019-11-01"), y: 55 },
                    { x: new Date("2019-12-01"), y: 50 }
                ]
            }]
        }],
        navigator: {
            slider: {
                minimum: new Date("2018-07-01"),
                maximum: new Date("2019-06-30")
            }
        }
    };

    $("#stockChartContainer").CanvasJSStockChart(stockChartOptions);
Interactive jQuery StockCharts
Related StockChart Packages