Dynatrace Cordova Plugin
This plugin gives you the ability to use the Dynatrace instrumentation in your hybrid application (Cordova, Ionic, Capacitor ..). It uses the Mobile Agent and the JavaScript Agent. The Mobile Agent will give you all device specific values containing lifecycle information and the JavaScript Agent will allow you to manually instrument your JavaScript/TypeScript code out of the box (TypeScript definitions included). The JavaScript Agent will cover the network calls (depending on your used libraries) and will automatically detect them.
Versioning
The dynatrace-cordova-plugin is the old version of this plugin. Consider it deprecated. Only use @dyntrace/cordova-plugin from now on, if you want to have the newest version. If you are upgrading from the old version have a look at our migration guide which is explaining what has changed. The versioning changed as well, the old 7.2.x was based on the versions of the Mobile Agents used. Now the plugin has its own versioning. The version of the used Mobile Agent can be seen here.
Requirements
- For Linux users: Bash (Only a requirement if you are using Linux)
- For Android users:
- SDK version 21+
- Gradle version 6.1.1+ (How to update?)
- Android Gradle plugin version 4.0+
- For iOS users: Minimum iOS 9
- For JavaScript Agent: access to API of cluster
- Node: > 12.x
Agent Versions
This agent versions are configured in this plugin:
- iOS Agent: 8.253.1.1006
- Android Agent: 8.253.1.1003
Quick Setup
- Installation of the plugin
- Configuration with Dynatrace
- Make a build
- Validate instrumentation
Advanced Topics
Quick Setup
1. Installation of the plugin
To install the plugin in your Cordova based project you must enter the following command in the root directory of your cordova based project. E.g. :
cordova plugin add @dynatrace/cordova-plugin --save
2. Configuration with Dynatrace
If you want to instrument your Cordova application just go to your Dynatrace WebUI and select the menu point "Deploy Dynatrace". Choose to setup mobile monitoring and select Cordova. Afterwards it is possible for you to add the Web part (JavaScript Agent) automatically and download the dynatrace.config.js file.
This file should be placed in the root of your project (same place where the package.json is stored). If the file is not available the instrumentation will not work.
Ionic Webview for Cordova: If you are using the Ionic WebView for Cordova (cordova-plugin-ionic-webview) you need to make sure you set correct cookie domain.
3. Make a build
After starting the Cordova or Ionic build, with ionic cordova build android or cordova build android the instrumentation will be handled by the plugin. Of course android can be substituted with ios platform. If you have trouble with not finding the .gradle, .plist or dynatrace.config.js file you can specify those via custom arguments. E.g. cordova build android --config=C:\config\dynatrace.config.js is a valid command and will try to use the configuration stored in the \config folder.
4. Validate instrumentation
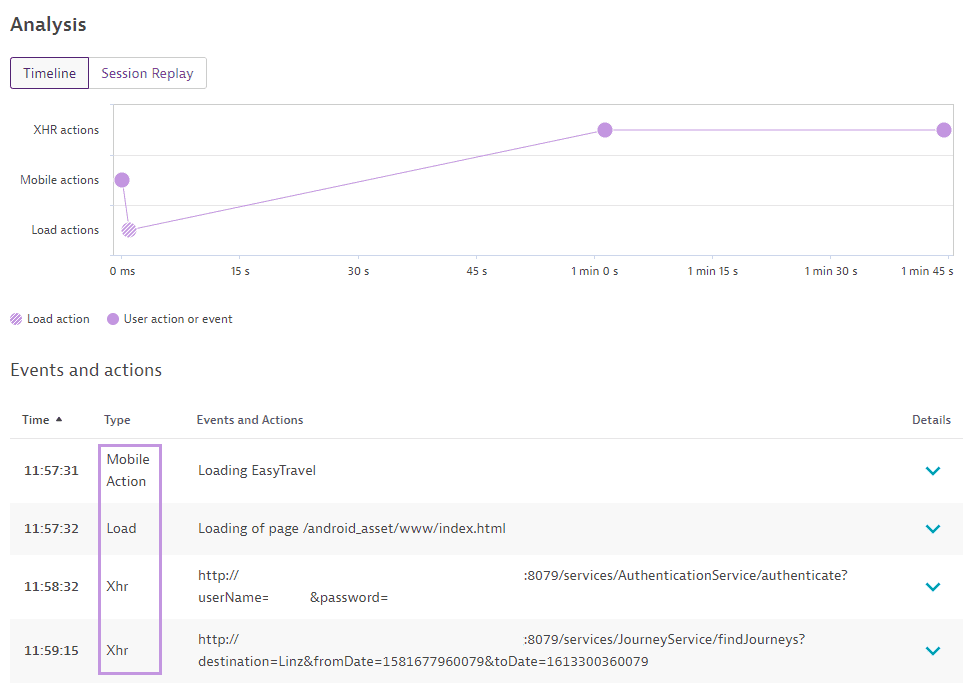
This section should explain what data should be visible after applying the plugin. The most important aspect is that there should be a combined session. We talk about a combined session when there are Mobile and Web actions within one session.

This screen shows what a combined sample user session should roughly look like. The session contains a Mobile action and some Web(Load, XHR) actions. Those first two actions should always be visible in your application session. The first one defines the native application startup ("Loading EasyTravel"). The second one defines the first load of the index.html of your hybrid application ("Loading of page ..").
Advanced Topics
Capacitor Instrumentation
To instrument your Ionic Capacitor app, you will need to follow the steps below:
- Install the Dynatrace Cordova Plugin via the following command:
npm install @dynatrace/cordova-plugin
- Go to your Dynatrace WebUI and select the menu point "Deploy Dynatrace". Choose to setup mobile monitoring and select Cordova. Click the Monitor the web view button if you have not already.
- Click the Download dynatrace.config.js button and move the downloaded file to the root of your capacitor project.
- Make sure you add "http://localhost" (or something else if you have configured a different scheme) to the Android configuration domains in the dynatrace.config.js:
hybridWebView {
    enabled true
    domains 'http://localhost', '.yourotherdomains.com'
}
- Run the following commands (replace
<platform> with ios or android):
- Run your application (if you did not use the run command)
Note:
Capacitor 3.1 added new hooks inside of their CLI. This allows us to instrument your application when using the ionic capacitor run or capacitor run commands.
Cordova configuration
Note:
If both custom CLI arguments and custom configuration arguments are used, custom CLI arguments will be used.
module.exports = {
  cordova : {
      debug : false,
      cspURL: "http://...",
      cookieProxy: false,
      jsAgentPath: "/path/to/jsAgent.txt",
      gradlePath: "/path/to/build.gradle",
      plistPath: "/path/to/Info.plist"
    },
  ...
}
Debug property
The default value is false. This property generates more log output and is sometimes necessary if you need to find the cause for a non-working plugin.
Content Security Policy url
There is flag for updating the CSP (Content Security Policy). By default this value is set and the plugin will modify the CSP. The URL in the cspURL property will be placed into a CSP configuration (if available) in your index.html. This will allow/unblock connections to the Dynatrace server. If you don't want to use this feature, remove the cspURL property and the plugin will not modify the CSP configuration.
Cookie Proxy
Issues with cookies are somehow a persistent companion in Ionic or Capacitor applications. Therefor we provide a proxy script which is wrapping the document.cookie API and are storing the cookies which are important for the Dynatrace Agents in the session storage. Of course this wrapping is still calling the original API.
Per default the cookie proxy is turned off. To make use of this proxy you need to enable it in the cordova configuration in the dynatrace.config.js:
module.exports = {
  cordova : {
      cookieProxy: true
    },
  ...
}
The true in the cookieProxy property will insert a dt-cookie-proxy.js script in the index.html.
JS Agent Path
If you want to use a local script/text file that includes the JS Agent snippet downloaded from the WebUI or retrieved from using the Dynatrace API. Note that you can name the file whatever you want but the file and directory that you use needs to exist. The file downloaded from the WebUI will be named jsSnippet.txt by default.
Gradle Path
If your top level build.gradle is not in the standard location or you want to use a specific build.gradle, you can specify a path to the desired file. We will assume that the other gradle file resides in /app/build.gradle. This will add all agent dependencies automatically for you and will update the configuration.
Plist Path
Tell the script where your Info.plist file is. The plist file is used for updating the configuration for the iOS agent.
Mobile Agent configuration
module.exports = {
    android : {
		config : `...`
    },

    ios : {
        config : `...`
    }
}
The native configuration contain all the settings which are necessary for the Mobile Agent(s). You can find all the available properties in the documentation of the mobile agent.
The content of the ios.config property will be directly copied to the plist file. The content of the android.config property will be directly copied to the gradle file.
Hybrid related configuration
Here we list the configuration which is especially important if you are instrumenting a Hybrid application.
module.exports = {
    android : {
		config : `
		dynatrace{
			configurations {
				defaultConfig{
					autoStart{
						...
					}
					hybridWebView{
						enabled true
						domains '.example.com', '.dynatrace.com'
					}
				}
			}
		}
		`
    },

    ios : {
		config : `
    <key>DTXHybridApplication</key>
    <true/>
    <key>DTXSetCookiesForDomain</key>
    <array>
      <string>.example.com</string>
      <string>.dynatrace.com</string>
    </array>
		`
    }
}
-
DTXHybridApplication or hybridWebView.enabled : Set to true if you have a Hybrid application. The default value is false.
-
DTXSetCookiesForDomain or hybridWebView.domains : For hybrid applications using the JavaScript agent, cookies need to be set for each instrumented domain or server the application communicates with. You can specify domains, host or IP addresses. Domains or sub-domains must start with a dot. Separate the list elements with a comma.
JavaScript Agent configuration
Basically all needed properties for the JavaScript Agent are predefined by the downloadable dynatrace.config.js. There are three available properties:
url - Dynatrace API url to retrieve the JS agent script tag.mode - Values can be numbers 0-4 depending on what JavaScript Agent code snippet you want to use.allowanycert - Allows the plugin to ignore certificate issues when retrieving the JavaScript Agent.
JavaScript Agent Snippet Mode
Using a specific mode can allow you during build to insert any of the available JavaScript agent code snippet options that are offered.
Click here for more details on the options listed below:
- 0 -
jsInlineScript - 1 -
jsTagComplete - 2 -
syncCS (Default) - 3 -
asyncCS - 4 -
jsTag
module.exports = {
    js : {
        url : `https://.../jsInlineScript/...`,
        mode: 2
    },
}
The above example will use mode option 2 and retrieve the synchronous code snippet of the JavaScript agent.
Note:
The default url value will be used if mode is not included in the dynatrace.config.js file or if mode exists and the value is not valid (i.e. not a number 0 through 4).
Allow any certificate
If you are having an issue retrieving the JavaScript Agent and see an error message relating to a certificate:
Could not retrieve the JavaScript Agent! - Could not retrieve agent optionsError: unable to verify the first certificate
You are able to bypass those errors at your OWN RISK by using allowanycert: true within the js property. This will ignore the fact that the SSL connection is not secure (e.g. because of invalid certificate) and will retrieve the JavaScript Agent snippet anyways. An example would look like this:
module.exports = {
    js : {
        url : `...`,
        allowanycert: true
    },
}
Manual instrumentation
The JavaScript Agent interface will be provided by the JavaScript Agent, it can be used everywhere in your application by simply calling dtrum.
This gives you the possibility to instrument your code even further by adding manual instrumentation. If you like to know more about the manual instrumentation, have a look into the Dynatrace documentation.
Create custom action
To create a custom action that is called "MyButton tapped" you just need to use the following code below. The leaveAction will close the action again. It is possible to report errors for this action before closing, see next section Report Error.
"enterAction"(actionName: string, actionType: string, startTime?: number, sourceUrl?: string, sourceTitle?: string): number;

"leaveAction"(actionId: number, stopTime?: number, startTime?: number): void;
var action = dtrum.enterAction('simple action', 'click', null, 'http://whatever.com');
dtrum.leaveAction(action);
Report error
For any open action you can report certain values. The following APIs are available on the Action:
reportError(error: Error | string, parentActionId?: number): void;

dtrum.reportError('Error: Hello World with AJAX!');
Identify user
It is possible to identify a user and tag the current session with a name. You need to do the following call:
dtrum.identifyUser("User XY");
More examples
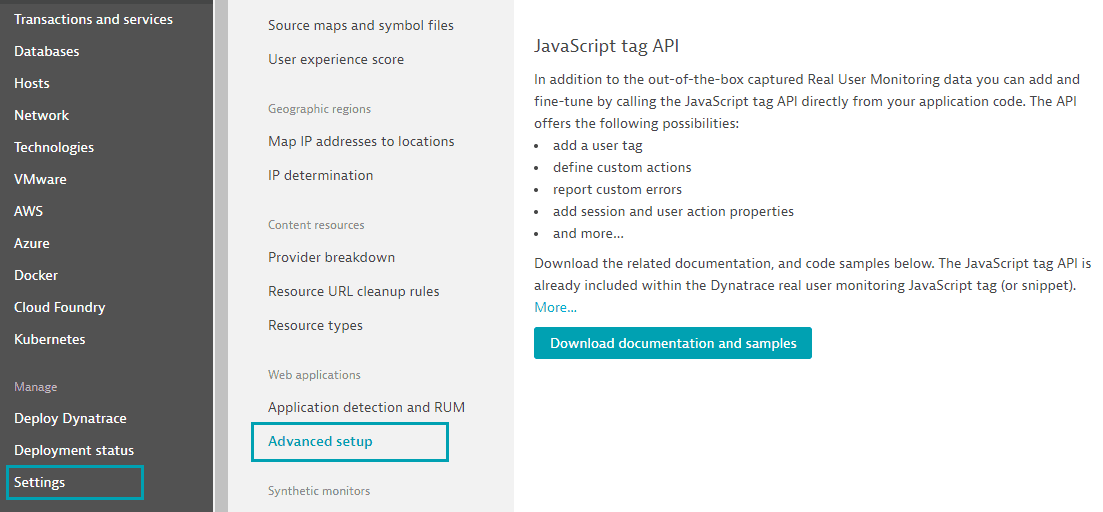
The above functionalities are only a small part of how you can use the API. If you want to know more you can visit the Settings in the WebUI.

Typings file for JavaScript Agent API
If you are using typescript and want to use the manual instrumentation of the JSAgent you should install the typings. The typings are available under the package name @dynatrace/dtrum-api-types. External typings have the advantage that you can apply the version that is actually needed.
After installing the typings, they can be used by inserting the following line at the top of the file:
or including the typings in your tsconfig.json file:
"files": [
    "node_modules/@dynatrace/dtrum-api-types/dtrum.d.ts"
]
Be aware if you are using typescript you need to prefix your dtrum calls with window. as the typings file is made for all web applications.
This means a call to enterAction might look like this:
window.dtrum.enterAction(...)

or

let dtrum = window.dtrum;
dtrum.enterAction(...);
Manual instrumentation - Mobile Agent
The Mobile Agent interface will be provided by the Mobile Agent, so it can be used everywhere in your application by simply calling dynatraceMobile.
End session
In a hybrid scenario it is only possible for the mobile agent to end a session/visit. That's why we expose the endVisit function of the Mobile Agent.
The interface is available with the name dynatraceMobile (TypeScript definitions included). Calling dynatraceMobile.endVisit(successCallback, errorCallback) will end the session/visit. Example how this call looks like:
dynatraceMobile.endVisit(() => {
console.log("Visit was ended!");
}, () => {
console.log("Visit wasn't ended!");
});
You can also use the dtrum API directly to end the session:
dtrum.endSession(...);
Note: This API is not available in the typings file as we add it for convenience at runtime. If you are using typescript you might want to use dynatraceMobile.endSession(...).
User Privacy Options
Specifies if the user has to opt-in for being monitored. When enabled, you must specify the privacy setting. The following in configuration is needed to be able to use the API.
Android
android: {
  config: `
    dynatrace {
      configurations {
        defaultConfig {
          autoStart{
            ...
          }
          userOptIn true
        }
      }
    }
  `
}
iOS
ios: {
  config: `
  <key>DTXUserOptIn</key>
  </true>
  `
}
The privacy API methods allow you to dynamically change the data-collection level based on the individual preferences of your end users. Each end user can select from three data-privacy levels:
const enum DataCollectionLevel {
	Off, Performance, UserBehavior
}
- Off: Native Agent doesn't capture any monitoring data.
- Performance: Native Agent captures only anonymous performance data. Monitoring data that can be used to identify individual users, such as user tags and custom values, aren't captured.
- UserBehavior: Native Agent captures both performance and user data. In this mode, Native Agent recognizes and reports users who re-visit in future sessions.
Here are some examples of how to use the API:
To check the current privacy options that are set:
dynatraceMobile.getUserPrivacyOptions((result) => {
if(result) {
console.log(`Current Data Collection Level: ${result.dataCollectionLevel}`);
console.log(`Current Crash Reporting Value: ${result.crashReportingOptedIn}`);
}
}, (error) => {
console.log(`Error: ${error}`);
});
If you want to change the UserPrivacyOptions:
dynatraceMobile.applyUserPrivacyOptions(DataCollectionLevel.UserBehavior, true, () => {
  console.log("Success");
}, () => {
  console.log("Error");
});
Typings file for Mobile Agent API
To use the interface of the Mobile Agent directly you must specify the typing definition file in the tsconfig.json. Add the following block to the tsconfig.json:
"files": [
    "node_modules/@dynatrace/cordova-plugin/typings/main.d.ts"
]
If "files" is already defined, just add the path to the already defined ones.
If you still don't get types in your .ts file, please insert the following snippet at the top of your .ts file:
/// <reference types="@dynatrace/cordova-plugin" />
Native Webrequests
Attention: This feature requires a instrumented webserver with version 1.211.x
Within Cordova it is also possible to use libraries that are executing native web requests. Some examples are: cordova-plugin-advanced-http, @ionic-native/http, cordova-plugin-okhttp or Mobile First by IBM.
Those libraries are not executing the request within the JS scope but will rather call a JavaScript<->Native interface and will trigger the request natively. This means that our JavaScript OneAgent will not be able to detect the request. Additionally a resulting user action can be dropped as well. To prevent this behaviour you need to manually apply headers to your request.
Before using this feature you need to turn of web request instrumentation on iOS. You can do this by adding the following configuration to the dynatrace.config.js:
ios: {
  config: `
  <key>DTXInstrumentWebRequestTiming</key>
  <false/>
  `
}
The following code will create a user action and a linked web request for you:
MyTestRequest request = new MyTestRequest("MY_URL");
let interceptorUtils = dynatraceMobile.getNativeNetworkInterceptorUtils();
let actionId = interceptorUtils.enterNativeRequestAction("MY_URL", "Name of HTTP Framework", "Optional Action Fallbackname");
request.addHeaders(interceptorUtils.getHeadersForNativeRequest(actionId));
request.send();
interceptorUtils.leaveNativeRequestAction(actionId);
IBM Mobile First
Attention: This feature requires a instrumented webserver with version 1.211.x running at your Mobile First server. Also, only version >= 8.x.x is supported.
If you are using IBM Mobile First you might take a look at our dynatraceMobile.getMobileFirstNetworkInterceptor(). This interceptor gives you the option to make the request going to Mobile First more visible. The Mobile First library is doing native mobile web requests, that's why those request can't be linked with user actions happening in the web part.
This interceptor is creating wrapping actions according to the user input that happened right before the request. By this modification you will be able to see the request in the user session linked with user actions.
Before using this feature you need to turn of web request instrumentation on iOS. You can do this by adding the following configuration to the dynatrace.config.js:
After Mobile First has been initialized make the following call:
dynatraceMobile.getMobileFirstNetworkInterceptor().enableInterceptor("https://serverurl.com");
if(dynatraceMobile.getMobileFirstNetworkInterceptor().isInterceptorEnabled()){
}
It is also possible to deactivate the interceptor again. This will reset the modifications to the WLResourceRequest:
dynatraceMobile.getMobileFirstNetworkInterceptor().disableInterceptor();
if(!dynatraceMobile.getMobileFirstNetworkInterceptor().isInterceptorEnabled()){
}
Ionic WebView for Cordova
The Mobile agent usually sets cookies on the correct domain but the cordova-plugin-ionic-webview uses different domains. Those domains need to be added in the configuration. If you defined a custom hostname you need to take this into account as well for choosing the correct domain. A sample configuration which takes care about the default domain for cordova-plugin-ionic-webview looks like the following:
module.exports = {
    android : {
		config : `
		dynatrace{
			configurations {
				defaultConfig{
					autoStart{
						...
					}
					hybridWebView{
						enabled true
						domains 'http://localhost', '.other-domain-you-want-to-specify.com'
					}
				}
			}
		}
		`
    },

    ios : {
		config : `
		<DTXHybridApplication>true</DTXHybridApplication>
		<DTXSetCookiesForDomain>ionic://localhost,.other-domain-you-want-to-specify.com</DTXSetCookiesForDomain>
		`
    }
}
Download older plugin version
The version can be used like in any other npm package. You just have to use the @ sign if you want to specify a certain version:
cordova plugin add @dynatrace/cordova-plugin@1.191.1 --save
This will download the version 1.191.1 of our plugin. In general we recommend you to always use the latest version.
Custom arguments for instrumentation script
Notes:
- If both custom CLI arguments and custom configuration arguments are used, custom CLI arguments will be used.
- Custom arguments will not work with Capacitor based projects.
Our scripts assumes that the usual cordova project structure is given. The following arguments can be specified for our instrumentation script if the project structure is different.
--gradle=C:\MyCordovaAndroidProject\platforms\android\build.gradle - the location of the root build.gradle file. We will assume that the other gradle file resides in /app/build.gradle. This will add all agent dependencies automatically for you and will update the configuration.--plist=C:\MyCordovaIOSProject\platforms\ios\projectName\projectName-Info.plist - Tell the script where your Info.plist file is. The plist file is used for updating the configuration for the agent.--config=C:\SpecialFolderForDynatrace\dynatrace.config.js - Used for if you have not added your config file in the root folder of the Cordova project but somewhere else.--jsagent=C:\MyCordovaProject\scripts\jsSnippet.txt - If you want to use a local script/text file that includes the JS Agent snippet downloaded from the WebUI or retrieved from using the Dynatrace API. Note that you can name the file whatever you want but the file and directory that you use needs to exist. The file downloaded from the WebUI will be named jsSnippet.txt by default.
Example:
cordova build android --config=C:\SpecialFolderForDynatrace\dynatrace.config.js
If you use Ionic make sure to use -- :
ionic cordova build android -- --config=C:\SpecialFolderForDynatrace\dynatrace.config.js
Additional Note:
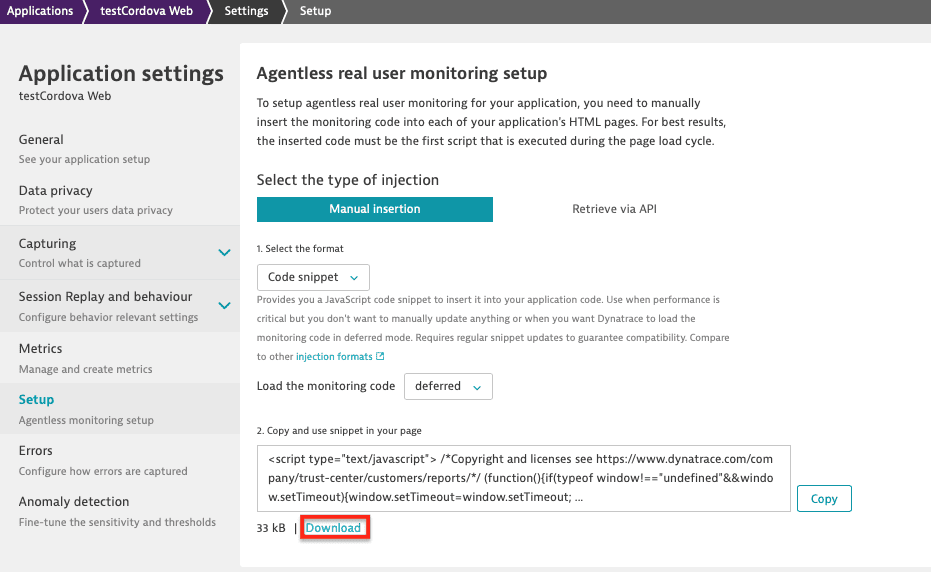
For the local script file, we copy the specified file 1:1. It is best to download the JS agent snippet from the WebUI after selecting the desired JS agent format and clicking the Download link below the shown code snippet. To get to this page, go to your Web Application settings and then select Setup. The contents of the file will be copied 1:1 inside of the <head> tag of your Cordova applications platform based html files.

Migration from old plugin
The differences to the old dynatrace-cordova-plugin are very small. There are three differences:
- The Android instrumentation is now executed via gradle. This makes the build way faster and more stable. The new plugin is now automatically modifying your gradle files.
- The plugin raised the requirements for Gradle to version 6. This can easily be upgraded in your project by changing one line.
- The format of the configuration changed from
dynatrace.config to dynatrace.config.js. The new format can be downloaded via WebUI. If you had some custom settings in Android take a look in the detailed documentation. The format of iOS basically stayed the same.
Updating to Gradle 6
Updating Gradle only affects your Android build. To Update your project to Gradle 6 you have to modify one file in your Android folder.
ProjectFolder\android\cordova\lib\builders\ProjectBuilder.js Contains the following line:
var distributionUrl = process.env['CORDOVA_ANDROID_GRADLE_DISTRIBUTION_URL'] || 'https\\://services.gradle.org/distributions/gradle-4.3.10-all.zip';
make sure you insert some other version like 6.1.1 here:
var distributionUrl = process.env['CORDOVA_ANDROID_GRADLE_DISTRIBUTION_URL'] || 'https\\://services.gradle.org/distributions/gradle-6.1.1-all.zip';
If you having trouble with this option you can always set the global process property CORDOVA_ANDROID_GRADLE_DISTRIBUTION_URL :
process.env['CORDOVA_ANDROID_GRADLE_DISTRIBUTION_URL'] = 'https\\://services.gradle.org/distributions/gradle-6.1.1-all.zip';
MavenCentral in top level gradle file
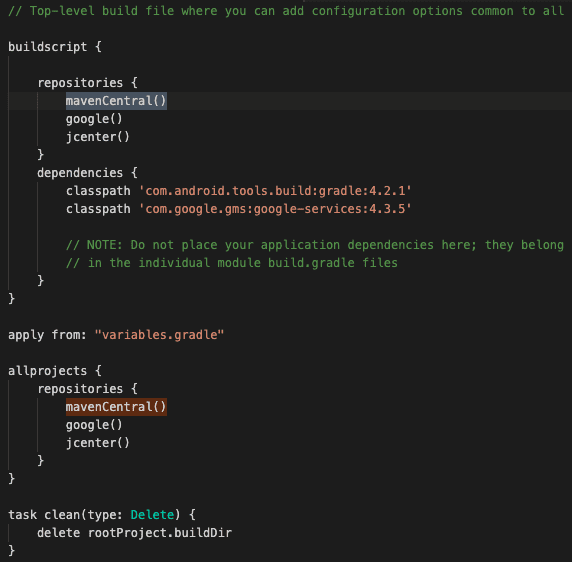
Because the Dynatrace Android agent now requires the MavenCentral repository, if either jcenter() or mavenCentral() is not added inside of ALL the repositories blocks via the top-level build.gradle, the build will fail.
Below is an example of what a basic top-level build.gradle file should look like after adding mavenCentral() to all repository blocks:

The location of the top-level build.gradle should be:
- Cordova/Ionic:
<rootOfProject>\platforms\android\build.gradle
- Ionic/Capacitor:
<rootOfProject>\android\build.gradle
Note:
JCenter has noted its sunset on May 1st. Though, JCenter is still syncing with Maven Central so havingjcenter() in your build.gradle file without the use of mavenCentral() will retrieve the Dynatrace Android Gradle Plugin no problem.
Native OneAgent debug logs
If your application starts but you see no data (or the session is not merged), you probably need to dig deeper to find out why the OneAgents aren't sending any data. Opening up a support ticket is a great idea, but gathering logs first is even better. Please attach the mobile agent logs and the doctor dynatrace logs when opening a support ticket.
Android
Add the following configuration snippet to your other configuration in dynatrace.config.js right under the autoStart block (the whole structure is visible, so you know where the config belongs):
android: {
  config: `
    dynatrace {
      configurations {
        defaultConfig {
          autoStart{
            ...
          }
          debug.agentLogging true
        }
      }
    }
  `
}
iOS
Add the following configuration snippet to your other configuration in dynatrace.config.js (the whole structure is visible, so you know where the config belongs):
ios: {
  config: `
  <key>DTXLogLevel</key>
  <string>ALL</string>
  `
}
Official documentation
Doctor Dynatrace
Doctor dynatrace is a tool that will analyze your project and determine if there is something wrong with your current configuration and will also provide information and requirements based on features that are available when using our plugin.
To run this tool, open terminal in the root directory of your project and run the following command: npm run doctorDynatrace
The results will be generated in the terminal window as well as stored in log folder located in the following directories:
- Cordova/Ionic =>
C:\MyCordovaProject\plugins\dynatrace-cordova-plugin\logs\currentDoctorDynatrace.txt - Capacitor =>
C:\MyCapacitorIOSProject\node_modules\@dynatrace\cordova-plugin\logs\currentDoctorDynatrace.txt
The log file will also include a list of your package.json dependencies and devDependencies which will be helpful when investigating possible issues that arise. Please add this doctor dynatrace log and mobile agent debug logs when opening a support ticket.
Troubleshooting and current restrictions
Note:
The Dynatrace Android Gradle plugin is hosted on Maven Central. JCenter has noted it's sunset on May 1st so Maven Central is the primary source of the Dynatrace Android Gradle plugin.
Basically if you have problems with the plugin please have a look into the logs. They will tell you what went wrong. The logs can be found in the plugins folder of your Cordova project. There is a directory called "Logs".
- If you see a message like "Error: Could not retrieve the JSAgent! Error: self signed certificate in certificate chain" try to switch the JavaScript Agent configuration from HTTPS to HTTP.
- If you use live reload (e.g. ionic cordova run android -l) be aware that Ionic/Cordova doesn't use files from the platform folder, so the JavaScript Agent injection will not take place, as we only instrument the temporary platform folder. You are still able to add the copied JS Agent code snippet from the WebUI manually to your index.html (in the source directory). To get to this page, go to your Web Application settings and then select Setup. Auto-Instrumentation with the Mobile Agent still takes place.
- If you have problems retrieving the JavaScript Agent and you get error messages that the JavaScript Agent can not be retrieved, you probably don't have access to the API or there is a certificate issue. If this is the certificate use the allowanycert feature. In any other case a workaround is possible to use the cli and add the
--jsagent= custom parameter and download the full Javascript Agent and add the path to the downloaded JS Agent file to the custom parameter value - With this the plugin will not retrieve the JS agent and will use the one that is specified. - If you are not seeing data when using Capacitor 3+, please make sure you follow the steps in the Capacitor Instrumentation section (more specifically step 4 for the proper commands). Please read the note at the bottom of that section for more information.
- For Android, if you see an error like "Gradle sync failed: Could not find com.dynatrace.tools.android:gradle-plugin:8.221.1.1005.", please see the MavenCentral section for an example and more information.
iOS Session Correlation Issues
iOS apps using ionic/capacitor have issues with passing cookies from the native layer to WkWebView layer. This issue is due to ionic and capacitor using their own default custom schemes (i.e. ionic:// or capacitor://) and the strict policy of Apple's WebKit not allowing cookies to be set in WkWebView with these custom schemes.
To resolve this issue and allow the Mobile and Web sessions to correlate properly, we inject the session information into local storage so that the JavaScript agent can use this info for the Web session it creates.
Requirements
- iOS agent version 8.219.1.1004+ (already included in our plugin)
- JavaScript agent version 1.219+
- Any version lower will not check local storage and correlation of the mobile and web sessions will not occur.
Using Apple Pay with WebKit/WKWebView
When using Apple Pay with WKWebView, there are specific checks that WebKit (Apple) uses when loading the Apple Pay SDK. The Apple Pay SDK does not work when using script injection APIs which is what our iOS agent uses to properly communicate with the JS agent and to correlate the Mobile and Web User Sessions.
Workaround: You can set the DTXHybridApplication flag to false which will remove the injection of our script. This will also remove the correlation of the Mobile and Web Sessions.
Changelog
1.255.1
1.253.5
- Updated Android (8.253.1.1003) & iOS Agent (8.253.1.1006)
- Fixed wrong declaration for dtrum & MFP API
- Fixed broken export of axios library
1.247.0
- Added support for Capacitor run command for Capacitor versions 3.1+
- Added option to specify paths for jsAgent, gradlePath and plistPath in
dynatrace.config.js file - Improved capacitor check for specific platforms logic
- Updated Android (8.247.1.1003) & iOS Agent (8.247.1.1007)
- Minimum Android SDK has been raised to SDK 21 and above
1.233.1
- Fixed issue where old static lib was referenced
- Improved capacitor check logic
- Improved injection logic for html
- Updated Android (8.231.2.1007) & iOS Agent (8.233.1.1006)
1.229.0
- Adding SessionStorage values to Native web request instrumentation
- Updated Android (8.229.1.1003) & iOS Agent (8.229.1.1004)
1.227.6
- Added Cookie Proxy for Ionic & Capacitor
- Fixed dynatraceMobile.applyUserPrivacyOptions for Android
- Fixed wrong check for missing dtrum
- Fixed incorrectly reading cspURL value
- Fixed waiting for async hooks to complete
- Updated Android (8.227.1.1002) & iOS Agent (8.227.1.1019)
1.225.1
1.225.0
- Added doctor dynatrace command to check for problems
- Removed check and adding of -ObjC linker for Capacitor apps
- Added support for Capacitor 3
- Enhanced user action creation/correlation for Native WR/MFP requests
- Updated Android (8.223.1.1003) & iOS Agent (8.223.1.1006)
- IBM MFP Wrapper is now passing all arguments
- Removed JSAgent typings which are available via NPM
1.219.1
- Fixed issue with older Android versions
- Fix for custom CLI arguments not being checked issue
- Updated iOS (8.219.1.1004)
- Added support for MFP API sendFormParameters
1.217.1
1.213.0
- Added new custom parameter for cli to allow use of local js agent script file
- Added mode option in the config file for using specific JSAgent code snippet
- No longer store JS Agent file and only inject platform html
- Added dtrum API that will prevent errors if JS agent is not loaded
- Updated iOS (8.209.1.1003) and Android Agent (8.211.1.1010)
- Skipping not readable files instead of throwing an exception
1.205.0
- Updated iOS and Android agent
1.201.0
- Updated iOS and Android agent
1.192.0
- Fix for Installation/Removing issues
1.191.2
- Android Instrumentation changed to Gradle
- New Mobile Agents (> 8.x)


