Research
Security News
Malicious npm Package Targets Solana Developers and Hijacks Funds
A malicious npm package targets Solana developers, rerouting funds in 2% of transactions to a hardcoded address.
@erboladaiorg/expedita-accusamus
Advanced tools
[![build status][build-badge]][build] [![code coverage][coverage-badge]][coverage] [![npm version][version-badge]][package]
Front-end logger, which will:
This is a great tool to use if you want to do logging on the client side in the same way you do on the server, without worrying about sending off a million beacons. You can quickly get an idea of what's going on on your client, including error cases, page transitions, or anything else you care to log!
var $logger = beaver.Logger({
url: "/my/logger/url",
});
$logger.info(<event>, <payload>);Queues a log. Options are debug, info, warn, error.
For example:
$logger.error('something_went_wrong', { error: err.toString() })
$logger.track(<payload>);Call this to attach general tracking information to the current page. This is useful if the data is not associated with a specific event, and will be sent to the server the next time the logs are flushed.
$logger.metricCounter(<event>, <payload>);Queues a counter metric, helper wrapping logger.metric
logger.metricCounter({
  namespace: "pp.team.product.feature",
  event: "button_click",
  dimensions: {
    type: "paypal"
  }
})
const logger = new Logger({...options, metricNamespacePrefix: "company.team.app"})

logger.metricCounter({
  namespace: "product.feature",
  event: "button_click",
})

// creates metric with namespace of
// company.team.app.product.feature
$logger.metricGauge(<event>, <payload>);Queues a gauge metric, helper wrapping logger.metric
logger.metricGauge({
  namespace: "pp.team.product.feature",
  event: "request_latency",
  value: 100,
  dimensions: {
    method: "GET"
  }
})
const logger = new Logger({...options, metricNamespacePrefix: "company.team.app"})

logger.metricGauge({
  namespace: "product.feature",
  event: "request_latency",
  value: 100
})

// creates metric with namespace of
// company.team.app.product.feature
$logger.metric(<event>, <payload>);Queues a metric. We suggest using the metricCount or metricGauge interface for better type safety and clearer intention in your code.
$logger.addMetaBuilder(<function>);Attach a method which is called and will attach general information to the logging payload whenever the logs are flushed
$logger.addMetaBuilder(function () {
  return {
    current_page: getMyCurrentPage(),
  };
});
$logger.addMetricDimensionBuilder(<function>);Attach a method which is called and will attach values to each metric's dimensions whenever the logs are flushed
$logger.addMetricDimensionBuilder(() => ({
  token_used: true,
  type: "user_id_token",
}));
$logger.addPayloadBuilder(<function>);Attach a method which is called and will attach values to each individual log's payload whenever the logs are flushed
$logger.addPayloadBuilder(function () {
  return {
    performance_ts: window.performance.now(),
  };
});
$logger.addTrackingBuilder(<function>);Attach a method which is called and will attach values to each individual log's tracking whenever the logs are flushed
$logger.addTrackingBuilder(function () {
  return {
    pageLoadTime: getPageLoadTime(),
  };
});
$logger.addHeaderBuilder(<function>);Attach a method which is called and will attach values to each individual log requests' headers whenever the logs are flushed
$logger.addHeaderBuilder(function () {
  return {
    "x-csrf-token": getCSRFToken(),
  };
});
$logger.flush();Flushes the logs to the server side. Recommended you don't call this manually, as it will happen automatically after a configured interval.
npm install --save beaver-logger
<script src="/js/beaver-logger.min.js"></script>
or
let $logger = require("beaver-logger");
Full configuration options:
var $logger = beaver.Logger({
  // Url to send logs to
  url: "/my/logger/url",

  // Prefix to prepend to all events
  prefix: "myapp",

  // Log level to display in the browser console
  logLevel: beaver.LOG_LEVEL.WARN,

  // Interval to flush logs to server
  flushInterval: 60 * 1000,

  // Use sendBeacon if supported rather than XHR to send logs; defaults to false
  enableSendBeacon: true,
});
beaver-logger includes a small node endpoint which will automatically accept the logs sent from the client side. You can mount this really easily:
let beaverLogger = require("beaver-logger/server");

myapp.use(
  beaverLogger.expressEndpoint({
    // URI to recieve logs at
    uri: "/api/log",

    // Custom logger (optional, by default logs to console)
    logger: myLogger,

    // Enable cross-origin requests to your logging endpoint
    enableCors: false,
  })
);
Or if you're using kraken, you can add this in your config.json as a middleware:
      "beaver-logger": {
          "priority": 106,
          "module": {
              "name": "beaver-logger/server",
              "method": "expressEndpoint",
              "arguments": [
                  {
                      "uri": "/api/log",
                      "logger": "require:my-custom-logger-module"
                  }
              ]
          }
      }
Setting up a custom logger is really easy, if you need to transmit these logs to some backend logging service rather than just logging them to your server console:
module.exports = {
  log: function (req, level, event, payload) {
    logSocket.send(
      JSON.stringify({
        level: level,
        event: event,
        payload: payload,
      })
    );
  },
};
flowchart TD
    A[Client-Side Log statement] --> B[beaver-logger/client]
    B[beaver-logger/client] --> C[beaver-logger/server]
    C[beaver-logger/server] --> D[your-custom-logger]
    D[your-customer-logger] --> E[Backend 1]
    D[your-customer-logger] --> F[Backend 2]
    G[Server-Side Log statement] --> D[your-custom-logger]
FAQs
[![build status][build-badge]][build] [![code coverage][coverage-badge]][coverage] [![npm version][version-badge]][package]
The npm package @erboladaiorg/expedita-accusamus receives a total of 0 weekly downloads. As such, @erboladaiorg/expedita-accusamus popularity was classified as not popular.
We found that @erboladaiorg/expedita-accusamus demonstrated a healthy version release cadence and project activity because the last version was released less than a year ago. It has 0 open source maintainers collaborating on the project.
Did you know?

Socket for GitHub automatically highlights issues in each pull request and monitors the health of all your open source dependencies. Discover the contents of your packages and block harmful activity before you install or update your dependencies.

Research
Security News
A malicious npm package targets Solana developers, rerouting funds in 2% of transactions to a hardcoded address.

Security News
Research
Socket researchers have discovered malicious npm packages targeting crypto developers, stealing credentials and wallet data using spyware delivered through typosquats of popular cryptographic libraries.

Security News
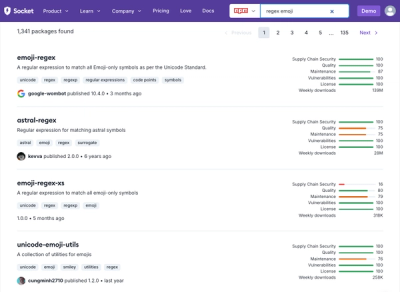
Socket's package search now displays weekly downloads for npm packages, helping developers quickly assess popularity and make more informed decisions.