
Research
/Security News
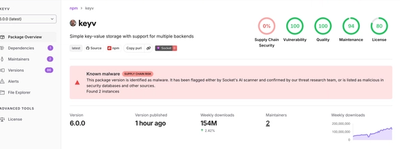
Popular npm Packages in the keyv and Cacheable Namespaces Compromised in Active Supply Chain Attack
Popular npm packages keyv and cacheable compromised.
By Socket Research Team - Aug 04, 2026
@frontmcp/observability
Advanced tools
OpenTelemetry instrumentation, structured JSON logging, and request log objects for FrontMCP
OpenTelemetry instrumentation, structured JSON logging, and Prometheus metrics for FrontMCP servers.

Install the plugin and every MCP request produces a trace span, a structured log line, and counters — without touching your tool code.
npm install @frontmcp/observability
import { ObservabilityPlugin } from '@frontmcp/observability';
import { FrontMcp } from '@frontmcp/sdk';

@FrontMcp({
  info: { name: 'my-server', version: '1.0.0' },
  apps: [MyApp],
  plugins: [ObservabilityPlugin],
})
class Server {}
plugins: [
  ObservabilityPlugin.configure({
    logging: { level: 'info', includeRequestBody: false },
    otel: { serviceName: 'my-server', endpoint: process.env.OTEL_EXPORTER_OTLP_ENDPOINT },
  }),
];
Do not log request bodies in production unless you have reviewed them for PII — tool arguments frequently carry user data.
import { PROMETHEUS_CONTENT_TYPE, renderPrometheusExposition } from '@frontmcp/observability';

http: {
  routes: [
    {
      method: 'GET',
      path: '/metrics',
      handler: (_req, res) => {
        res.setHeader('Content-Type', PROMETHEUS_CONTENT_TYPE);
        res.status(200).send(renderPrometheusExposition());
      },
    },
  ];
}
renderJsonExposition() returns the same data as JSON when you would rather
scrape structured output.
/metricsis unauthenticated in the snippet above. Bind it to an internal interface, or put it behind auth, before exposing the server publicly.
| Export | Purpose |
|---|---|
ObservabilityPlugin | The plugin — add it to plugins: [] |
setupOTel | Wire an OTel SDK yourself instead of via the plugin |
FrontMcpPropagator | W3C trace-context propagator for FrontMCP contexts |
McpAttributes, RpcAttributes, HttpAttributes | Semantic-convention attribute keys |
renderPrometheusExposition, renderJsonExposition | Metrics rendering |
ProcessStatsCollector | Memory / event-loop / uptime sampling |
reportStartup | Emit a structured boot record |
Protocol revision 2026-07-28 carries OpenTelemetry context in the request
_meta (traceparent, tracestate, baggage) per SEP-414, and FrontMCP echoes
it back on the result. A client can therefore stitch its span to the server's
without an out-of-band correlation id — see the
protocol versions guide.
Full guide: Observability · Metrics
Apache-2.0
FAQs
OpenTelemetry instrumentation, structured JSON logging, and request log objects for FrontMCP
The npm package @frontmcp/observability receives a total of 53 weekly downloads. As such, @frontmcp/observability popularity was classified as not popular.
We found that @frontmcp/observability demonstrated a healthy version release cadence and project activity because the last version was released less than a year ago. It has 1 open source maintainer collaborating on the project.
Did you know?

Socket for GitHub automatically highlights issues in each pull request and monitors the health of all your open source dependencies. Discover the contents of your packages and block harmful activity before you install or update your dependencies.
Research
/Security News
Popular npm packages keyv and cacheable compromised.

Security News
A misconfiguration gave three Anthropic models internet access, and one, believing it was in a simulation, shipped a credential-stealing package to PyPI.

Security News
/Company News
Socket has joined the new Composer and Packagist sponsorship program as a launch sponsor, supporting the team that keeps PHP's package ecosystem secure.