Security News
JSR Working Group Kicks Off with Ambitious Roadmap and Plans for Open Governance
At its inaugural meeting, the JSR Working Group outlined plans for an open governance model and a roadmap to enhance JavaScript package management.
@meniga/graphs
Advanced tools
Meniga’s charting components are all written in D3.js and follow the general update pattern of D3.js
In order to fully understand the components it is necessary to have some basic understanding on D3.js
Some reading:
All our charting components follow they same pattern where updateGraph plays the most crucial role. It’s responsibility is to bind the data with the elements and update them depending on which “bucket” they fall into; update vs. enter vs. exit (see general update pattern).
It is important that the code remains fairly simple and it is advised not to add to many options in order to maintain code readability. In many cases it is far simpler to create a new graph.
It is worth noting that all D3 gist examples can be viewed by removing the “gist.github.com“ prefix and replacing it with “bl.ocks.org”.
There are six pre-defined charting components available: Area, Bar, Pie, Column, Scatter and StackedColumn. Each component can take in four props: data, settings, options, listeners.
It is also possible to use the general Graph component, which then requires one additional prop called "type". This component is useful when you want to have a single charting component that can easily change type.
Each charting component can take in an optional settings object, which controls d3 charting behaviors. If no settings props is defined, a general default configuration will be used. You can decide to omit this prop and use the default settings, use your own settings object, or you can also use one of the default configuration settings that are available for each type of charting component, which can be found under @cosmic/graphs/lib/configs.
To use those, you should import them like so:
import areaConfig from '@meniga/graphs/lib/configs/areaGraph';
<Area
settings={ areaConfig }
}/>
Chart options is an object that defines the height of the chart, the x and y positions of where the chart should be drawn on the SVG canvas, and whether or not to show a legend or send back data that can be used to show a tooltip. Height, x and y are required fields, showLegend and showTooltip are optional.
Example:
{
	height: 375,
	x: 100,
	y: 30
}
The chart data should be a JSON object in the following format:
{
	seriesIndex: index,
	timeResolution: [Day|Week|Month|Year],
	statistics: {},
	values: [
		{
			x: [amount|date],
			y: [date|amount],
			seriesIndex: index,
			text: "some text"
		}
	]
}
If you use data from the /Transactions/Series API, you can use the "prepareData" method from the /src/utils/SeriesHelper utility to create your chart data.
Listeners should be a JSON object that defines what functions should be called when certain events are triggered. Available events are: handleHoverOut, handleHoverOver
Example:
{
    handleHoverOut: this.hideTooltip(),
    handleHoverOver: this.showTooltip()
}
The type of a chart is a predefined string, that can be found in @cosmic/graphs/lib/constants/GraphTypes.js
Example:
import * as GraphTypes from '@meniga/graphs/lib/constants/GraphTypes';

<Graph
    type={ GraphTypes.AREA_GRAPH }
    { ...props }
}/>
// ES6
import Bar from '@meniga/graphs/Bar';

// ES5
var Bar = require('@meniga/graphs/Bar');

<Bar
    data={ Array#series }
    settings={ Object }
    options={
    	height: 375,
    	showLegend: true,
    	x: 100,
    	y: 30
}/>
// ES6
import Pie from '@meniga/graphs/Pie';

// ES5
var Pie = require('@meniga/graphs/Pie');

<Pie
    data={ Array#series }
    settings={ Object }
    options={
    	height: 500,
    	x: 100,
    	y: 100
}/>
// ES6
import Graph from '@meniga/graphs/Graph';
import * as GraphTypes from '@meniga/graphs/lib/constants/GraphTypes';

// ES5
var Graph = require('@meniga/graphs/Graph');
var GraphTypes = require('@meniga/graphs/lib/constants/GraphTypes');

<Graph
    type={ GraphTypes.AREA_GRAPH }
    data={ Array#series }
    settings={ Object }
    options={
    	height: 500,
    	x: 100,
    	y: 100
}/>
FAQs
Meniga Graphing component library
The npm package @meniga/graphs receives a total of 182 weekly downloads. As such, @meniga/graphs popularity was classified as not popular.
We found that @meniga/graphs demonstrated a healthy version release cadence and project activity because the last version was released less than a year ago. It has 0 open source maintainers collaborating on the project.
Did you know?

Socket for GitHub automatically highlights issues in each pull request and monitors the health of all your open source dependencies. Discover the contents of your packages and block harmful activity before you install or update your dependencies.

Security News
At its inaugural meeting, the JSR Working Group outlined plans for an open governance model and a roadmap to enhance JavaScript package management.

Security News
Research
An advanced npm supply chain attack is leveraging Ethereum smart contracts for decentralized, persistent malware control, evading traditional defenses.

Security News
Research
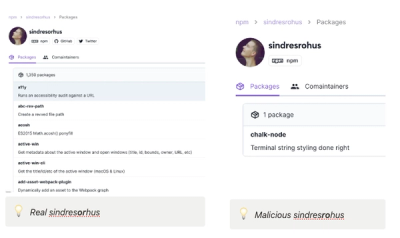
Attackers are impersonating Sindre Sorhus on npm with a fake 'chalk-node' package containing a malicious backdoor to compromise developers' projects.