Product
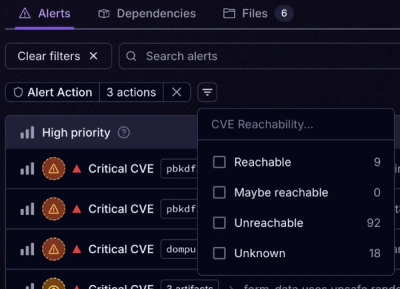
Introducing Tier 1 Reachability: Precision CVE Triage for Enterprise Teams
Socket’s new Tier 1 Reachability filters out up to 80% of irrelevant CVEs, so security teams can focus on the vulnerabilities that matter.
@pager/metrics-client
Advanced tools
Hapi-centric Prometheus Plugin and optional endpoint
Use this plugin to:
/metrics).metrics in request contexts)/metrics on port 3000)Once metric-client is a Hapi-centric Prometheus Plugin. Hapi and metrics-client modules need to be installed.
npm install -S @hapi/hapi
npm install -S @pager/metrics-client
Sample usage for metrics-client server
'use strict';

const Hapi = require('@hapi/hapi');
const Metrics = require('@pager/metrics-client');

const startServer = async () => {

    const server = await new Hapi.Server({
        port: 3000
    });
    await server.register([
        {
            plugin: Metrics
        }
    ]);
    await server.start();
    console.log( `Server started at ${ server.info.uri }`);
    return server;
};

module.exports = startServer();
annotations:
  prometheus.io/scrape: "true"
  prometheus.io/port: {{ .Values.service.internalPort | quote }}
Readiness probes are designed to let Kubernetes know when your app is ready to serve traffic. Similarly, liveness probes let Kubernetes know if your app is alive or dead. Metric-client plugin is also support health check and needs to be added to the deployment file under container details.
livenessProbe:
  httpGet:
    path: /health
    port: {{ .Values.service.internalPort }}
  initialDelaySeconds: 15
  timeoutSeconds: 1
readinessProbe:
  httpGet:
    path: /health
    port: {{ .Values.service.internalPort }}
  initialDelaySeconds: 15
  timeoutSeconds: 1
Prometheus server Kubernetes service discovery configuration is going to search running server on kubernetes cluster. It will use default server port 3000. Thus, metrics-client must start at default port 3000. If the server is not already running on port 3000, it should be added on containers details.
env:
  - name: PORT
  value: "3000"
Health endpoint is designed to provide information about a readiness and liveness of the server. On the other hand, metrics endpoint provides information about the performance of the server such as load time, response time, memory usage, CPU usage etc.
| Metrics List |
|---|
| cpu_user_time |
| cpu_user_utilization |
| cpu_system_time |
| cpu_system_utilization |
| event_loop_usage |
| event_loop_wait |
| memory_physical |
| memory_heap_used |
| memory_heap_free |
| memory_heap_max |
| memory_nonheap_used |
| http_request_duration_milliseconds |
| http_request_buckets_milliseconds |
| gc_pause_time_min |
| gc_pause_time_max |
| gc_pause_time_total |
| gc_scavenge_min |
| gc_scavenge_max |
| gc_scavenge_total |
| gc_marksweepcompact_min |
| gc_marksweepcompact_max |
| gc_marksweepcompact_total |
| gc_incrementalmarking_min |
| gc_incrementalmarking_max |
| gc_incrementalmarking_total |
FAQs
Hapi Prometheus Plugin and optional endpoint
The npm package @pager/metrics-client receives a total of 478 weekly downloads. As such, @pager/metrics-client popularity was classified as not popular.
We found that @pager/metrics-client demonstrated a not healthy version release cadence and project activity because the last version was released a year ago. It has 46 open source maintainers collaborating on the project.
Did you know?

Socket for GitHub automatically highlights issues in each pull request and monitors the health of all your open source dependencies. Discover the contents of your packages and block harmful activity before you install or update your dependencies.

Product
Socket’s new Tier 1 Reachability filters out up to 80% of irrelevant CVEs, so security teams can focus on the vulnerabilities that matter.

Research
/Security News
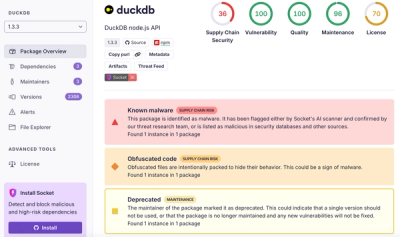
Ongoing npm supply chain attack spreads to DuckDB: multiple packages compromised with the same wallet-drainer malware.

Security News
The MCP Steering Committee has launched the official MCP Registry in preview, a central hub for discovering and publishing MCP servers.