
Security News
Crates.io Users Targeted by Phishing Emails
The Rust Security Response WG is warning of phishing emails from rustfoundation.dev targeting crates.io users.
By Sarah Gooding - Sep 12, 2025
@redsift/d3-rs-bars
Advanced tools
d3-rs-bars generate a range of bar charts. Supports stacked and un-stacked series, hovers and highlights.


![]()
View @redsift/d3-rs-bars on CodePen
Full example @redsift/d3-rs-bars as REFViewer on CodePen
View @redsift/d3-rs-bars Collection on CodePen


<script src="//static.redsift.io/reusable/d3-rs-bars/latest/d3-rs-bars.umd-es2015.min.js"></script>
<script>
	var chart = d3_rs_bars.html();
	chart.fill('global');
	d3.select('body').datum([ 1, 2, 3, 10, 100 ]).call(chart);
</script>
import { html as bars } from "@redsift/d3-rs-bars";
import { select } from "d3-selection";

let chart = bars();
select('body').datum([ 1, 2, 3, 10, 100 ]).call(chart);
var chart = require("@redsift/d3-rs-bars");
var eml = chart.html();
...
[1,2,3,4...] Datum Bricks Example[[1,2],[20,4],[10,30]] to form stacked bar chart. Datum Bricks ExamplelabelTime property to set the date format. Datum Bricks Example| Property | Description | Transition | Preview |
|---|---|---|---|
classed | String Customise SVG by adding, removing and toggling of CSS classes. | N | |
background | Sting, Array, Function Change the background colour of the SVG container. Background colour can be set using a colour name, rgb or hex value. | Y |  Examples: Bricks/CodePen |
theme | String Customise the chart theme including 'light'(default) and 'dark'. | Y |  Examples: Bricks/ CodePen |
fill | Sting, Array, Function Change the bar chart colour using a String which can take colour name, rgb or hex value as an argument. Using an Array of custom colours or use 'global' to generate random colour or supply a custom function. | Y |   |
style | String Custom CSS to inject into chart. | N | |
width, height | Integer Resize the height and width of the chart. Default width: 420 pixels. | Y |  Examples: Bricks/CodePen |
size | Integer Resize the chart to a certain size changing both the width and height maintaining a default aspect ratio. | Y |  Examples: Bricks/CodePen |
scale | Integer Scale the entire chart by the scaling value. Used to zoom the chart or compensate for high DPI displays when rasterized. Default scale: 1 | Y |  Examples: Bricks/CodePen |
margin | Number Change the chart margin inside of the SVG container. Default margin: 26. | Y |  Examples: Bricks,CodePen |
inset | Number Resize the space inside the chart margin for the main chart element. This excludes items like legends. Comparing Margin & Inset legend where the legend get distorded while using margin on using a big value. | Y |  Examples: Bricks/CodePen |
highlight | (Array of)Integer Highlight an array of value or a particular value. | Y |  Examples: Bricks/CodePen |
minValue,maxValue | Number Sets the minimum and maximum Value scale range. Note that for log scales, minValue must be > 0. | Y |  Examples: Bricks/CodePen |
legend | (Array of) String Add legends to the chart where array of String can be supply for multiple bar chart. | N |  Examples: Bricks/CodePen |
legendOrientation | String Position the legend, positions include top, bottom, left or right. Default orientation : 'bottom' | Y |  Examples: Bricks/CodePen |
orientation | String Set the orientation of the labels. Default oriented : left. Parameters include right,left,top and bottom. | Y |  Examples: Bricks/CodePen |
rotateValue,rotateIndex | Integer Rotate the Index or Value ticks in degree where positive degree represent clockwise rotation and negative degree anticlockwise rotation. Default rotation : 0. | Y |  Examples: Bricks/CodePen |
labelTime | String Interpret the label as a millisecond epoch and format it using specified string. | N |  Examples: Bricks/CodePen |
barSize | Interger Change the size of the bar elements. Positive value set the absolute value in pixels. Negative values specify the scale relative to space between ticks. i.e. -0.5 will set the bar size to 50% of the width between the ticks. Default size set to 6. | Y |  Above Brick Example  Above Brick Example / CodePen |
tickDisplayValue | String, Integer Rename all tick to a single argument by supplying a String or a Number. | N |  Examples: Bricks/CodePen |
label | String Use the same labels for value using a String or an Integer. | N |  Examples: Bricks/CodePen |
tickFormatValue, tickFormatIndex | String, Function Set the formatting string or function for the ticks. | N | [ Examples: Bricks/ CodePen |
tickCountValue, tickCountIndex | Number, String, Interval Function Hints at the number of ticks to set in the corresponding axis. Supports strings for example split time intervals, apply when using epoch time format. Default tickCountIndex: 6 | N |  Examples: Bricks/CodePens |
displayTip | Integer Position the tip display on the bar chart on hovering. | Y | CodePen Example |
displayHtml | String,Function Customise the tip info. Function parameters include (d,i), d represent data and i the dataset. | N | CodePen Example |
stacked | Boolean Enable bar chart to stack onto each other. | Y |  Examples: Bricks/CodePen |
value | Function Generate a bar chart from selecting an object values carrying the data to generate the bar chart. | N | CodePen Example |
grid | Boolean Enable grid to display on the chart. Default: true. | N |  Examples: Bricks/CodePen |
logValue | Integer Alter the grid spacing for value. | Y |  Examples: Bricks/CodePen |
language | String Change the language format of the chart affecting digit, currency and time formats. | N | CodePen Example |
The two main time formatter available are UTC and Local Time. UTC uses the time standard applied across the world which is unaffected by Daylight Saving Time whereas Local Time is set to your local timezone.
To use any of the formatters, string specifiers is passed to the labelTime function. To apply UTC format, d3.utcFormat(specifier) is used as a parameter to labelTime, specifier being the string specifiers. When using Local Time, only string specifiers can be passed to labelTime since by default the time format is set to Local Time.
Additional information about Time format for D3 can be found here.
FAQs
Generates bar charts using D3v4.
We found that @redsift/d3-rs-bars demonstrated a not healthy version release cadence and project activity because the last version was released a year ago. It has 23 open source maintainers collaborating on the project.
Did you know?

Socket for GitHub automatically highlights issues in each pull request and monitors the health of all your open source dependencies. Discover the contents of your packages and block harmful activity before you install or update your dependencies.
Security News
The Rust Security Response WG is warning of phishing emails from rustfoundation.dev targeting crates.io users.
Product
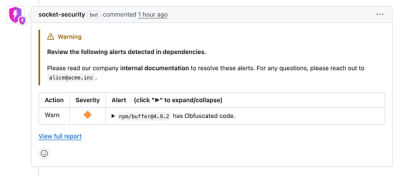
Socket now lets you customize pull request alert headers, helping security teams share clear guidance right in PRs to speed reviews and reduce back-and-forth.

Product
Socket's Rust support is moving to Beta: all users can scan Cargo projects and generate SBOMs, including Cargo.toml-only crates, with Rust-aware supply chain checks.