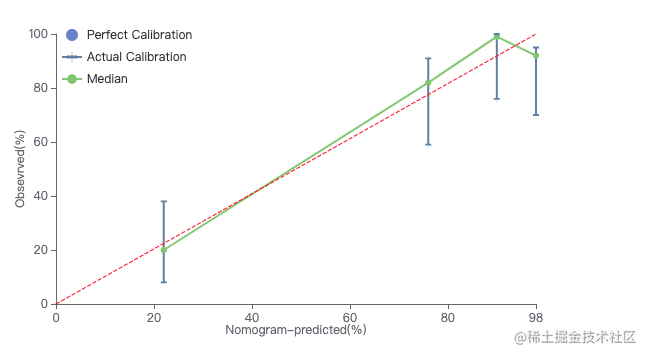
校准曲线图

import { initCalibrationCurve } from '~'
const chartMap = new Map()
const xname = 'Nomogram-predicted(%)',yname = 'Obsevrved(%)';
const thresholdLineData = [
{
color:'#6e8bad',
data:[ [22,8],[22,38] ],
},
{
color:'#6e8bad',
data:[ [76,59],[76,91] ],
},
{
color:'#6e8bad',
data:[ [90,76],[90,100] ],
},
{
color:'#6e8bad',
data:[ [98,70],[98,95] ],
},
]
let comLineData= [[22,20],[76,82],[90,99],[98,92]]
const config = {
showLegend:false ,
}
initCalibrationCurve({ xname,yname,thresholdLineData,comLineData,id:'calibrationCurve',chartMap,config })


