Product
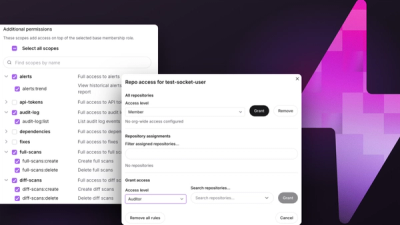
Introducing Repository Access Permissions and Custom Roles
Socket now supports Custom Roles and Repository Access Permissions so organizations can control who can access specific repositories and actions.
By Joe Werle - Jun 19, 2026
@silverassist/performance-toolkit
Advanced tools
PageSpeed Insights and Lighthouse CI integration for performance monitoring across SilverAssist projects
PageSpeed Insights and Lighthouse CI integration for performance monitoring across SilverAssist projects.

![]()
npm install @silverassist/performance-toolkit
performance-toolkit
yarn add @silverassist/performance-toolkit
pnpm add @silverassist/performance-toolkit
import { analyzeUrl } from "@silverassist/performance-toolkit";

const result = await analyzeUrl("https://www.example.com", {
  strategy: "mobile",
  apiKey: process.env.PAGESPEED_API_KEY,
});

console.log("Performance Score:", result.scores.performance);
console.log("LCP:", result.metrics.lcp.displayValue);
console.log("CLS:", result.metrics.cls.displayValue);
import { createPSIRunner, getDefaultThresholds } from "@silverassist/performance-toolkit";

// Production URLs - use PSI method (consistent hardware)
const runner = createPSIRunner(
  ["https://www.example.com/care-type"],
  process.env.PAGESPEED_API_KEY
)
  .withAssertions(getDefaultThresholds())
  .withTemporaryStorage();

const exitCode = await runner.run();
import { createNodeRunner } from "@silverassist/performance-toolkit";

// Staging URLs - use node method (local Chrome)
const runner = createNodeRunner([
  "https://staging.example.com/care-type",
]).withAssertions({
  performance: 50,
  lcp: 4000,
  fcp: 3000,
});

const exitCode = await runner.run();
# Basic analysis
perf-check https://www.example.com

# Desktop strategy with verbose output
perf-check https://www.example.com --desktop --verbose

# Audit export patterns for tree-shaking
perf-check --audit-exports

# CI mode (exit code 1 on failures)
perf-check https://www.example.com --ci --output results.json
| Option | Alias | Description |
|---|---|---|
--mobile | -m | Use mobile strategy (default) |
--desktop | -d | Use desktop strategy |
--verbose | -v | Show detailed output including opportunities |
--insights | -i | Show all detailed insights (for AI agents) |
--diagnostics | Show diagnostics table (PageSpeed format) | |
--actionable | -a | Generate actionable report with key opportunities |
--detect-context | Detect project technology stack | |
--audit-exports | Analyze export patterns for tree-shaking | |
--json | -j | Output structured JSON (for programmatic use) |
--ci | CI mode (exit with error on violations) | |
--output | -o | Output results to JSON file |
--baseline | -b | Compare against baseline file |
--config | -c | Path to configuration file |
--help | -h | Show help message |
Analyze Next.js bundle size and composition using @next/bundle-analyzer. This feature helps identify large dependencies, unused code, and optimization opportunities to reduce JavaScript bundle sizes.
# Analyze current Next.js project
perf-bundle

# Analyze specific project with auto-install
perf-bundle /path/to/nextjs-project --auto-install

# Generate reports and open in browser
perf-bundle --open --auto-install
| Option | Description |
|---|---|
project-path | Path to Next.js project directory (default: current directory) |
--auto-install | Automatically install @next/bundle-analyzer if missing |
--open | Open HTML reports in browser after analysis |
--help, -h | Show help message |
The perf-bundle command:
@next/bundle-analyzer in package.json--auto-install flag is providedANALYZE=true npm run build.next/analyze/Reports are created in .next/analyze/ directory:
Each report shows:
When perf-check identifies "Reduce unused JavaScript" opportunities, use perf-bundle to discover which specific dependencies are causing bloat:
# 1. Run performance check
perf-check https://your-site.com --insights

# 2. If "Unused JavaScript" is flagged, analyze bundle
perf-bundle --auto-install

# 3. Review generated reports to identify optimization targets
open .next/analyze/client.html
import { analyzeBundle } from "@silverassist/performance-toolkit";

const result = await analyzeBundle({
  projectPath: "/path/to/nextjs-project",
  autoInstall: true,
});

if (result.success) {
  console.log("Reports:", result.reports);
  console.log("Summary:", result.summary);
} else {
  console.error("Error:", result.error);
}
Note: The openBrowser option is only available via the CLI. For programmatic usage, handle report opening in your own code using the returned result.reports paths.
"Not a Next.js project" error:
package.json contains next in dependenciesBuild fails during analysis:
npm install)No reports generated:
.next/analyze/ directory existsThe toolkit provides detailed, structured insights that AI agents (like GitHub Copilot) can use to identify performance optimization opportunities and propose specific code changes.
# Get detailed insights in terminal format
perf-check https://www.example.com --insights

# Get machine-readable JSON for programmatic analysis
perf-check https://www.example.com --json > report.json
The --insights flag shows:
Example workflow for AI agents:
# 1. Generate structured report
perf-check https://example.com --json > perf-report.json

# 2. AI agent reads the report and identifies issues
# 3. AI agent proposes code changes based on insights.unusedJavaScript, etc.
The toolkit includes pre-built prompts for GitHub Copilot that provide structured workflows for performance optimization.
Install prompts:
# Create symlink to prompts (recommended - auto-updates with package)
npx perf-prompts install

# Or copy files instead (if you want to customize)
npx perf-prompts install --copy

# Check installation status
npx perf-prompts status

# Remove prompts
npx perf-prompts uninstall
Available prompts:
| Prompt | Description |
|---|---|
analyze-performance | Full performance analysis with actionable report |
optimize-lcp | LCP optimization with Next.js streaming-aware patterns |
optimize-bundle | JavaScript bundle analysis and code splitting |
nextjs-performance | Next.js App Router specific optimizations |
detect-context | Detect project technology stack |
performance-audit | Complete multi-phase audit |
Usage in VS Code:
@workspace /performance/analyze-performance https://your-site.com
@workspace /performance/optimize-lcp
@workspace /performance/nextjs-performance
Why symlinks? Symlinks ensure prompts stay up-to-date automatically when you update the package. If you need to customize prompts, use --copy instead.
Agent Skills are auto-loaded by GitHub Copilot based on context relevance (requires chat.useAgentSkills setting in VS Code).
| Skill | Description |
|---|---|
nextjs-performance | Next.js App Router performance patterns |
web-performance-analysis | General web performance optimization |
gtm-optimization | Google Tag Manager/GA4 performance optimization |
nextjs-tree-shaking | Tree-shaking optimization with named exports |
Skills are installed automatically with npx perf-prompts install.
analyzeUrl(url, options)Analyze a single URL using PageSpeed Insights API.
interface PageSpeedOptions {
  url: string;
  strategy?: "mobile" | "desktop";
  categories?: ("performance" | "accessibility" | "best-practices" | "seo")[];
  apiKey?: string;
  timeout?: number;
}
PageSpeedClientFull client for multiple analyses:
import { PageSpeedClient } from "@silverassist/performance-toolkit";

const client = new PageSpeedClient(process.env.PAGESPEED_API_KEY);

// Analyze both strategies
const { mobile, desktop } = await client.analyzeAll(
  "https://www.example.com"
);
LighthouseRunnerProgrammatic Lighthouse CI:
import { LighthouseRunner } from "@silverassist/performance-toolkit";

const runner = new LighthouseRunner({
  urls: ["https://example.com"],
  method: "psi", // or "node"
  psiApiKey: process.env.PAGESPEED_API_KEY,
  numberOfRuns: 3,
});

// Add assertions
runner.withAssertions({
  performance: 90,
  lcp: 2500,
  cls: 0.1,
});

// Configure upload
runner.withTemporaryStorage();
// or
runner.withLHCIServer("https://lhci.example.com", "build-token");

// Run
const exitCode = await runner.run();
getDefaultThresholds(strict?)Get recommended thresholds:
import { getDefaultThresholds } from "@silverassist/performance-toolkit";

// Standard thresholds
const standard = getDefaultThresholds();
// { performance: 50, lcp: 4000, fcp: 3000, cls: 0.25, tbt: 600 }

// Strict thresholds
const strict = getDefaultThresholds(true);
// { performance: 90, lcp: 2500, fcp: 1800, cls: 0.1, tbt: 200 }
detectProjectContext()Detect the project's technology stack:
import { detectProjectContext } from "@silverassist/performance-toolkit";

const context = await detectProjectContext();

console.log(context.framework); // { name: "Next.js", version: "14.2.0" }
console.log(context.isSSR);     // true
console.log(context.hasAppDir); // true
analyzeExports(options?)Analyze module export patterns for tree-shaking optimization:
import { analyzeExports } from "@silverassist/performance-toolkit";

const analysis = await analyzeExports({
  projectRoot: process.cwd(),
  includeDirs: ["src", "app", "components"],
  analyzeNextConfig: true,
});

console.log(analysis.summary);
// {
//   totalFiles: 127,
//   defaultExportFiles: 15,
//   namedExportFiles: 112,
//   problematicBarrelFiles: 3
// }

// Get recommendations
analysis.recommendations.forEach(rec => {
  console.log(`${rec.priority}: ${rec.title}`);
  console.log(`Impact: ${rec.impact.bundleSize}`);
});
Analysis includes:
index.ts re-exports)next.config.js optimizePackageImports configurationgenerateActionableReport(result, context?)Generate an actionable report with framework-specific recommendations:
import { analyzeUrl, generateActionableReport, detectProjectContext } from "@silverassist/performance-toolkit";

const result = await analyzeUrl("https://example.com");
const context = await detectProjectContext();
const report = generateActionableReport(result, context);

console.log(report.keyOpportunities);  // Top 3 prioritized opportunities
console.log(report.lcpAnalysis);       // LCP breakdown and recommendations
console.log(report.nextSteps);         // Prioritized action items
analyzeBundle(options?)Analyze Next.js bundle size and composition:
import { analyzeBundle } from "@silverassist/performance-toolkit";

const result = await analyzeBundle({
  projectPath: "/path/to/nextjs-project",
  autoInstall: true,
});

if (result.success) {
  console.log("Client bundle:", result.reports?.client);
  console.log("Recommendations:", result.summary?.recommendations);
} else {
  console.error("Analysis failed:", result.error);
}
BundleAnalyzerRunnerFull control over bundle analysis with logging callbacks:
import { BundleAnalyzerRunner } from "@silverassist/performance-toolkit";

const runner = new BundleAnalyzerRunner({
  projectPath: process.cwd(),
  autoInstall: true,
});

// Set up logging (optional)
runner.setLogCallback((msg) => console.log(msg));
runner.setErrorCallback((msg) => console.error(msg));

const result = await runner.analyze();
interface PerformanceResult {
  url: string;
  strategy: "mobile" | "desktop";
  timestamp: string;
  scores: {
    performance: number | null;
    accessibility: number | null;
    bestPractices: number | null;
    seo: number | null;
  };
  metrics: {
    lcp: MetricValue;
    fcp: MetricValue;
    cls: MetricValue;
    tbt: MetricValue;
    si: MetricValue;
    tti: MetricValue;
  };
  lcpElement?: {
    tagName: string;
    selector: string;
    url?: string;
  };
  opportunities: Opportunity[];
  diagnostics: Diagnostic[];
  fieldData?: LoadingExperience;
}
| Variable | Description |
|---|---|
PAGESPEED_API_KEY | Google PageSpeed Insights API key |
Get your API key at: https://developers.google.com/speed/docs/insights/v5/get-started
The CLI automatically loads .env.local or .env files from the current directory:
# .env.local
PAGESPEED_API_KEY=your-api-key-here
Then simply run:
perf-check https://www.example.com --insights
name: Performance Check

on: [push, pull_request]

jobs:
  performance:
    runs-on: ubuntu-latest
    steps:
      - uses: actions/checkout@v4
      - uses: actions/setup-node@v4
        with:
          node-version: '20'

      - name: Install dependencies
        run: npm ci

      - name: Run Performance Check
        env:
          PAGESPEED_API_KEY: ${{ secrets.PAGESPEED_API_KEY }}
        run: npx perf-check https://www.example.com --ci
pipelines:
  default:
    - step:
        name: Performance Check
        script:
          - npm ci
          - npx perf-check https://www.example.com --ci
        # Set PAGESPEED_API_KEY in Repository Settings > Pipelines > Environment variables
Based on Google's guidelines:
| Metric | Good | Needs Improvement | Poor |
|---|---|---|---|
| LCP | < 2.5s | 2.5s - 4s | > 4s |
| FCP | < 1.8s | 1.8s - 3s | > 3s |
| CLS | < 0.1 | 0.1 - 0.25 | > 0.25 |
| TBT | < 200ms | 200ms - 600ms | > 600ms |
Full TypeScript support with exported types:
import type {
  CoreWebVitals,
  MetricValue,
  PerformanceResult,
  PageSpeedOptions,
  LHCIOptions,
  PerformanceThresholds,
  BundleAnalyzerOptions,
  BundleAnalysisResult,
  ExportAnalyzerOptions,
  ExportAnalysisResult,
  ProjectContext,
  ActionableReport,
} from "@silverassist/performance-toolkit";
Import specific modules for smaller bundle size:
// PageSpeed module only
import { PageSpeedClient, analyzeUrl } from "@silverassist/performance-toolkit/pagespeed";

// Lighthouse module only
import { LighthouseRunner, createPSIRunner } from "@silverassist/performance-toolkit/lighthouse";

// Bundle module only
import { BundleAnalyzerRunner, analyzeBundle } from "@silverassist/performance-toolkit/bundle";

// Export analyzer module only
import { ExportAnalyzer, analyzeExports } from "@silverassist/performance-toolkit/analyzer";

// Context detection module only
import { ProjectContextDetector, detectProjectContext } from "@silverassist/performance-toolkit/context";

// Report generation module only
import { ActionableReportGenerator, generateActionableReport } from "@silverassist/performance-toolkit/report";

// Types only (no runtime code)
import type { PerformanceResult, CoreWebVitals, ExportAnalysisResult } from "@silverassist/performance-toolkit/types";
# Install dependencies
npm install

# Build
npm run build

# Test
npm test

# Type check
npm run typecheck

# Lint
npm run lint
PolyForm Noncommercial License 1.0.0
Made with ❤️ by Silver Assist
FAQs
PageSpeed Insights and Lighthouse CI integration for performance monitoring across SilverAssist projects
We found that @silverassist/performance-toolkit demonstrated a healthy version release cadence and project activity because the last version was released less than a year ago. It has 1 open source maintainer collaborating on the project.
Did you know?

Socket for GitHub automatically highlights issues in each pull request and monitors the health of all your open source dependencies. Discover the contents of your packages and block harmful activity before you install or update your dependencies.
Product
Socket now supports Custom Roles and Repository Access Permissions so organizations can control who can access specific repositories and actions.
Product
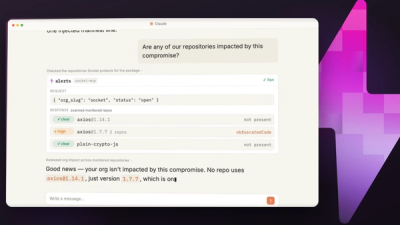
Socket MCP now lets AI assistants review org alerts, investigate threats using the Socket threat feed, and inspect package files in addition to dependency scoring.
Product
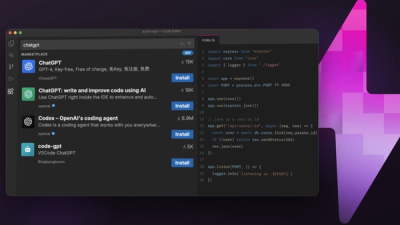
Socket Firewall blocks malicious VS Code and Open VSX extensions before install, protecting developers from compromised editor marketplaces.