@strata-packages/chart
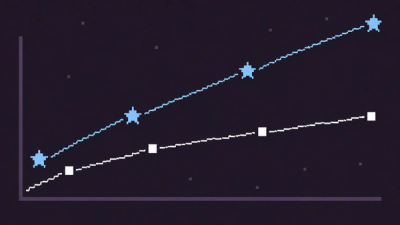
A Three.js-powered interactive chart component with 2D/3D toggle for Strata CSS. Supports bar, line, pie, and scatter charts. Works standalone or with Strata CSS.


Requirements
Three.js must be loaded before this script — window.THREE must exist.
<script src="https://cdn.jsdelivr.net/npm/three@0.160.0/build/three.min.js"></script>
<script src="node_modules/@strata-packages/chart/chart.js"></script>
Installation
npm install @strata-packages/chart three
Usage
Standalone
<script src="https://cdn.jsdelivr.net/npm/three@0.160.0/build/three.min.js"></script>
<script src="node_modules/@strata-packages/chart/chart.js"></script>
Available as StrataChart.create().
With Strata CSS
<script src="node_modules/strata-css/dist/strata.components.js"></script>
Available as Strata.Chart.create(). Do not load chart.js separately.
Quick Start
<div id="myChart" style="width:600px; height:400px;"></div>

<script>
  const chart = Strata.Chart.create('#myChart', {
    type: 'bar',
    view: '2d',
    data: [
      { label: 'Jan', value: 42 },
      { label: 'Feb', value: 67 },
      { label: 'Mar', value: 53 },
    ],
  })
</script>
Options
Strata.Chart.create(selector, {
type: 'bar' | 'line' | 'pie' | 'scatter',
view: '2d' | '3d',
theme: 'auto' | 'light' | 'dark',
data: [
{ label: string, value: number, category?: string }
],
colors: ['#hex', ...],
gridView: false,
showAxisLabels: false,
showScale: false,
showGridLabels: false,
highlightGridOnInteract: false,
onReady: (chart) => void,
onChange: (view) => void,
onClick: (point) => void,
})
Methods
const chart = Strata.Chart.create('#myChart', options)
chart.toggleView()
chart.setView('3d')
chart.update(newData)
chart.addDataPoint({ label, value, category? })
chart.addDataPoints([...])
chart.removeDataPoint(index)
chart.removeDataPoints([0, 2, 4])
chart.updateDataPoint(index, { label?, value?, category? })
chart.destroy()
Data Format
{ label: 'Q1', value: 120 }
{ label: 'Q1', value: 120, category: 'Revenue' }
Maximum data points: 100,000.
Chart Types
bar | Comparing discrete categories |
line | Trends over time |
pie | Part-to-whole proportions |
scatter | Correlation between variables |
Data Attributes (set on container)
The chart sets these on the container element for CSS styling hooks:
data-st-chart-view | '2d' / '3d' |
data-st-chart-type | 'bar' / 'line' / 'pie' / 'scatter' |
data-st-chart-loading | 'true' / 'false' |
data-st-chart-animated | 'true' / 'false' |
data-st-chart-hovered | 'true' / 'false' |
[data-st-chart-loading="true"] { opacity: 0.5; }
[data-st-chart-type="pie"] { border-radius: 50%; }
Events
All events fire on document:
document.addEventListener('st:chart:ready', e => { })
document.addEventListener('st:chart:change', e => { })
document.addEventListener('st:chart:update', e => { })
document.addEventListener('st:chart:click', e => { })
document.addEventListener('st:chart:destroy', e => { })
Theme Integration
theme: 'auto' reads data-st-theme from the nearest ancestor and updates colors automatically. No manual theme handling needed when using Strata CSS.
const chart = Strata.Chart.create('#myChart', { theme: 'auto', ... })
const chart = Strata.Chart.create('#myChart', { theme: 'dark', ... })
Camera Positions
The component uses two fixed camera presets:
2d | (0, 2, 22) | 18° | Near-orthographic flat projection |
3d | (3.5, 6.5, 9.5) | 42° | Elevated diagonal, cinematic |
Known Limitations
- Requires
window.THREE — Three.js must be loaded before the chart script
- Container element must have explicit
width and height (or CSS dimensions). Zero-size containers produce a blank canvas
- Maximum 100,000 data points before performance degrades
- SSR/Node environments not supported — requires
window and document
- Pie chart does not currently support 3D view (falls back to 2D)
License
MIT © Aftab Ibrahim Kazi