Product
Socket for Jira Is Now Available
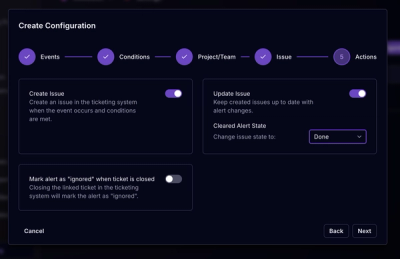
Socket for Jira lets teams turn alerts into Jira tickets with manual creation, automated ticketing rules, and two-way sync.
By Jeppe Hasseriis - Apr 20, 2026
@swimlane/ngx-charts
Advanced tools
FAQs
Declarative Charting Framework for Angular
The npm package @swimlane/ngx-charts receives a total of 154,594 weekly downloads. As such, @swimlane/ngx-charts popularity was classified as popular.
We found that @swimlane/ngx-charts demonstrated a healthy version release cadence and project activity because the last version was released less than a year ago. It has 29 open source maintainers collaborating on the project.
Did you know?

Socket for GitHub automatically highlights issues in each pull request and monitors the health of all your open source dependencies. Discover the contents of your packages and block harmful activity before you install or update your dependencies.
Product
Socket for Jira lets teams turn alerts into Jira tickets with manual creation, automated ticketing rules, and two-way sync.

Company News
Socket won two 2026 Reppy Awards from RepVue, ranking in the top 5% of all sales orgs. AE Alexandra Lister shares what it's like to grow a sales career here.

Security News
NIST will stop enriching most CVEs under a new risk-based model, narrowing the NVD's scope as vulnerability submissions continue to surge.