Security News
JSR Working Group Kicks Off with Ambitious Roadmap and Plans for Open Governance
At its inaugural meeting, the JSR Working Group outlined plans for an open governance model and a roadmap to enhance JavaScript package management.
@toast-ui/chart
Advanced tools

🍞📈 Spread your data on TOAST UI Chart. TOAST UI Chart is Beautiful Statistical Data Visualization library
TOAST UI Chart applies Google Analytics (GA) to collect statistics on the use of open source, in order to identify how widely TOAST UI Chart is used throughout the world. It also serves as important index to determine the future course of projects. location.hostname (e.g. > “ui.toast.com") is to be collected and the sole purpose is nothing but to measure statistics on the usage. To disable GA, use the following usageStatistics option when creating charts.
const options = {
  // ...
  usageStatistics: false,
};

toastui.Chart.barChart({ el, data, options });
The TOAST UI products can be installed by using the package manager or downloading the source directly. However, we highly recommend using the package manager.
The TOAST UI products are registered in npm package manager. Install by using the commands provided by a package manager. When using npm, be sure Node.js is installed in the environment.
$ npm install --save @toast-ui/chart # Latest version
$ npm install --save @toast-ui/chart@<version> # Specific version
The TOAST UI Chart is available over a CDN.
<link rel="stylesheet" href="https://uicdn.toast.com/chart/latest/toastui-chart.min.css" />
<script src="https://uicdn.toast.com/chart/latest/toastui-chart.min.js"></script>
- uicdn.toast.com/
  ├─ chart/
  │  ├─ latest
  │  │  ├─ toastui-chart.js
  │  │  ├─ toastui-chart.min.js
  │  │  ├─ toastui-chart.css
  │  │  ├─ toastui-chart.min.css
  │  ├─ v4.0.0/
Add the container element where TOAST UI Chart will be created.
<div id="chart"></div>
The TOAST UI Chart can be used by creating an instance with the constructor function. To access the constructor function, import the module using one of the three following methods depending on your environment.
/* namespace */
const chart = toastui.Chart;

/* CommonJS in Node.js */
const chart = require('@toast-ui/chart');

/* ES6 in Node.js */
import Chart from '@toast-ui/chart';
import { LineChart } from '@toast-ui/chart';
In Webpack 4, when importing package modules, the parts that are defined in the module field have higher priority than the parts defined in the main field. To use the Webpack 4 with the require syntax to import @toast-ui/chart, the ESM file defined in the module field will be loaded, and the file will be transpiled to be compatible with the require syntax. In order to use the bundle file for UMD, the user must personally load and use the @toast-ui/chart/dist/toastui-chart.js or @toast-ui/chart/dist/toastui-chart.min.js.
const Chart = require('@toast-ui/chart/dist/toastui-chart.min.js'); // loading the bundle file for UMD
Webpack 5 supports the exports field. The entry point can be determined by the exports field defined in the package. Furthermore, the necessary chart can be loaded through a sub-path, as presented below.
const Chart = require('@toast-ui/chart');  // ./dist/toastui-chart.js

import { BarChart } from '@toast-ui/chart';  // ./dist/esm/index.js

import BarChart from '@toast-ui/chart/bar';
import ColumnChart from '@toast-ui/chart/column';
import LineChart from '@toast-ui/chart/line';
import AreaChart from '@toast-ui/chart/area';
import LineAreaChart from '@toast-ui/chart/lineArea';
import ColumnLineChart from '@toast-ui/chart/columnLine';
import BulletChart from '@toast-ui/chart/bullet';
import BoxPlotChart from '@toast-ui/chart/boxPlot';
import TreemapChart from '@toast-ui/chart/treemap';
import HeatmapChart from '@toast-ui/chart/heatmap';
import ScatterChart from '@toast-ui/chart/scatter';
import LineScatterChart from '@toast-ui/chart/lineScatter';
import BubbleChart from '@toast-ui/chart/bubble';
import PieChart from '@toast-ui/chart/pie';
import NestedPieChart from '@toast-ui/chart/nestedPie';
import RadarChart from '@toast-ui/chart/radar';
Constructor function needs three parameters: el, data, options
const el = document.getElementById('chart');
const data = {
  categories: [
    //...
  ],
  series: [
    // ...
  ],
};
const options = {
  chart: { width: 700, height: 400 },
};

chart.barChart({ el, data, options });
// or
new BarChart({ el, data, options });
Refer to details for additional information.
FAQs
TOAST UI Application: Chart
The npm package @toast-ui/chart receives a total of 2,160 weekly downloads. As such, @toast-ui/chart popularity was classified as popular.
We found that @toast-ui/chart demonstrated a not healthy version release cadence and project activity because the last version was released a year ago. It has 2 open source maintainers collaborating on the project.
Did you know?

Socket for GitHub automatically highlights issues in each pull request and monitors the health of all your open source dependencies. Discover the contents of your packages and block harmful activity before you install or update your dependencies.

Security News
At its inaugural meeting, the JSR Working Group outlined plans for an open governance model and a roadmap to enhance JavaScript package management.

Security News
Research
An advanced npm supply chain attack is leveraging Ethereum smart contracts for decentralized, persistent malware control, evading traditional defenses.

Security News
Research
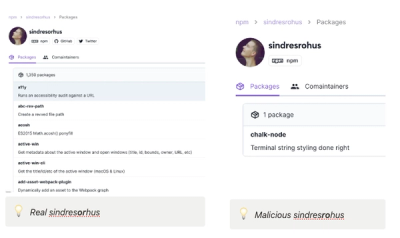
Attackers are impersonating Sindre Sorhus on npm with a fake 'chalk-node' package containing a malicious backdoor to compromise developers' projects.