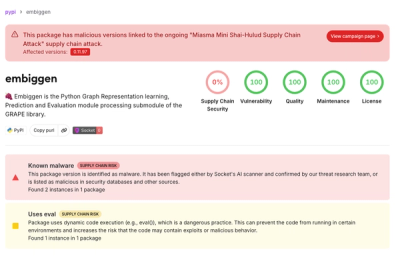
@tradecanvas/analytics
Backtesting, portfolio tracking, and risk analytics for TradeCanvas.
Preview release. API is stable but the engine has only been validated
against synthetic test fixtures. Treat results as indicative until you've
cross-checked them against your own reference implementation.
Install
npm install @tradecanvas/analytics @tradecanvas/commons
Backtester
Bar-by-bar engine. Strategy fn runs at close of each bar; orders fill on the next bar (market → next-bar open, limit/stop → when the next bar trades through the trigger price).
import { Backtester, FixedCommission, PercentSlippage } from '@tradecanvas/analytics'

const bt = new Backtester({
  initialCash: 10_000,
  commission: new FixedCommission(2),
  slippage: new PercentSlippage(0.0005),
  allowShort: true,
})

const result = bt.run(historicalBars, (ctx) => {
  if (!ctx.position) {
    ctx.placeOrder({ side: 'long', type: 'market', quantity: 1 })
  } else if (ctx.bar.close > ctx.position.averagePrice * 1.02) {
    ctx.close()
  }
})

console.log(result.metrics.sharpe, result.metrics.maxDrawdownPct)
StrategyContext
bar | Current bar |
index | Index of bar in the input series |
history | Bars up to and including bar |
position | Current position or null |
cash | Available cash |
equity | Cash + mark-to-market position value |
placeOrder(order) | Queue order for next bar |
close(tag?) | Market-close current position |
cancel(orderId) | Cancel a pending order |
Commission & slippage models
FixedCommission(perTrade)PercentCommission(rate) — fraction of notional, e.g. 0.001 = 10 bpsPerShareCommission(perShare, minimum?)PercentSlippage(rate) — adverse fraction of priceRangeBasedSlippage(factor) — proportional to bar range
Portfolio
Tracks cash, one net position, realized P&L, and the equity curve.
import { Portfolio } from '@tradecanvas/analytics'
const portfolio = new Portfolio({ initialCash: 10_000 })
portfolio.applyFill({ ... })
portfolio.mark(time, price)
portfolio.getPosition()
portfolio.getTrades()
portfolio.getEquityCurve()
portfolio.equity(price)
Currently single-position. Multi-symbol portfolios are on the roadmap.
Risk metrics
import { computeRiskMetrics } from '@tradecanvas/analytics'
const m = computeRiskMetrics(initialCash, equityCurve, trades, {
periodsPerYear: 252,
riskFreeRate: 0.03,
})
m.totalReturnPct
m.cagr
m.sharpe
m.sortino
m.calmar
m.maxDrawdownPct
m.winRate
m.profitFactor
m.expectancy
Strategy library
Reference strategies live under @tradecanvas/analytics — drop in, tune
parameters, run. All four implement the same StrategyFn shape and respect
the backtester's allowShort flag.
import {
  Backtester,
  smaCrossStrategy,
  rsiReversionStrategy,
  donchianBreakoutStrategy,
  bollingerReversionStrategy,
} from '@tradecanvas/analytics';

const bt = new Backtester({ initialCash: 10_000 });

const result = bt.run(bars, smaCrossStrategy({
  fastPeriod: 10,
  slowPeriod: 30,
  size: 1,
}));
smaCrossStrategy | Trend-following | fastPeriod, slowPeriod, size |
rsiReversionStrategy | Mean-reversion (long-only) | period, oversold, overbought, size |
donchianBreakoutStrategy | Trend breakout (Turtle-style) | entryPeriod, exitPeriod, size |
bollingerReversionStrategy | Mean-reversion to SMA | period, stdDev, size |
Each is a one-line function call returning a StrategyFn — easy to wrap,
combine, or compare side-by-side in a backtest harness.
Edge cases (current behavior)
- Gaps past a limit price: if the bar opens already through the limit, the order fills at the better of
open and the limit price.
- Stop orders inside a gap: fill at the worse of
open and the stop price.
- Bar that touches both stop and limit on the same bar: order resolves to the more pessimistic price for the current side (no intra-bar tick simulation).
These choices are conservative. A future release will offer a configurable intra-bar fill model.
License
MIT