Security News
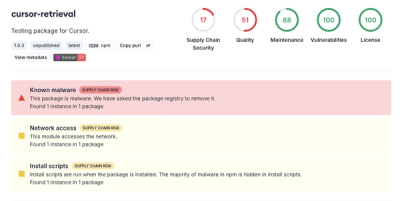
The Risks of Misguided Research in Supply Chain Security
Snyk's use of malicious npm packages for research raises ethical concerns, highlighting risks in public deployment, data exfiltration, and unauthorized testing.
@types/d3-shape
Advanced tools
TypeScript definitions for d3-shape
The @types/d3-shape package provides TypeScript type definitions for d3-shape, a D3 module for creating graphical shapes like lines, areas, arcs, pies, and more. These definitions allow developers to use d3-shape in TypeScript projects with type checking, enabling better development experience and error handling.
Line Generation
Generates a SVG path data string for a line connecting a series of points.
import * as d3 from 'd3-shape';
const line = d3.line()
.x((d) => d.x)
.y((d) => d.y);
const points = [{ x: 0, y: 0 }, { x: 10, y: 10 }];
const pathData = line(points);Area Generation
Creates an area defined by a line along its top edge and a baseline along the bottom.
import * as d3 from 'd3-shape';

const area = d3.area()
    .x((d) => d.x)
    .y0(0)
    .y1((d) => d.y);
const points = [{ x: 0, y: 0 }, { x: 10, y: 10 }];
const pathData = area(points);
Pie Chart Generation
Generates pie chart sectors, calculating the start and end angles for each data point.
import * as d3 from 'd3-shape';

const pie = d3.pie()
    .value((d) => d.value);
const data = [{ value: 10 }, { value: 20 }];
const arcs = pie(data);Chart.js is a powerful, flexible JavaScript charting library. It provides a wide variety of chart types, including line, area, and pie charts, similar to d3-shape. However, Chart.js is more focused on the entire charting experience, including axes and tooltips, whereas d3-shape is specifically about generating graphical shapes.
Victory is a React.js component library for building interactive data visualizations. It uses d3 under the hood for calculations but provides a React-friendly API. Compared to @types/d3-shape, Victory offers a higher-level abstraction, making it easier to integrate into React applications but less flexible for non-React projects.
npm install --save @types/d3-shape
This package contains type definitions for d3-shape (https://github.com/d3/d3-shape/).
Files were exported from https://github.com/DefinitelyTyped/DefinitelyTyped/tree/master/types/d3-shape.
These definitions were written by Tom Wanzek, Alex Ford, Boris Yankov, denisname, Nathan Bierema, and Fil.
FAQs
TypeScript definitions for d3-shape
The npm package @types/d3-shape receives a total of 4,038,432 weekly downloads. As such, @types/d3-shape popularity was classified as popular.
We found that @types/d3-shape demonstrated a healthy version release cadence and project activity because the last version was released less than a year ago. It has 0 open source maintainers collaborating on the project.
Did you know?

Socket for GitHub automatically highlights issues in each pull request and monitors the health of all your open source dependencies. Discover the contents of your packages and block harmful activity before you install or update your dependencies.

Security News
Snyk's use of malicious npm packages for research raises ethical concerns, highlighting risks in public deployment, data exfiltration, and unauthorized testing.

Research
Security News
Socket researchers found several malicious npm packages typosquatting Chalk and Chokidar, targeting Node.js developers with kill switches and data theft.

Security News
pnpm 10 blocks lifecycle scripts by default to improve security, addressing supply chain attack risks but sparking debate over compatibility and workflow changes.