
Product
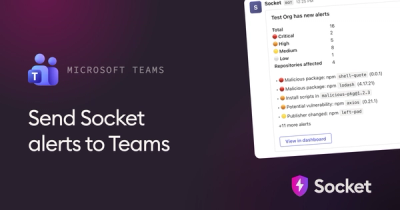
Microsoft Teams Notifications Are Now Available in Socket
Socket can now send alerts and supply chain attack notifications to Microsoft Teams, with filters that route the right updates to each channel.
By Jeppe Hasseriis - Sep 01, 2026
Open source agent observability — see what your agents did, why they failed, and what it cost. Runs locally.
Open source agent observability — see what your agents did, why they failed, and what it cost. Runs locally. No cloud required.
Here's how to connect your agent in 2 minutes: install the package, add agent-obs as an MCP server to your agent platform, tell the agent to self-report, and watch sessions appear in the dashboard.
npm install -g agent-observability
Add the MCP server to your opencode.json:
{
  "mcp": {
    "agent-obs": {
      "type": "local",
      "command": ["node", "/Users/williamweishuhn/Documents/New OpenCode Project/agent-observability/cli.js", "server"],
      "enabled": true
    }
  }
}
Then add this to your system prompt (e.g. in AGENTS.md):
After every tool call, call agent_obs_log_tool_call with the tool name, duration, status, input summary, and output summary. Start a session at the beginning of each task with agent_obs_start_session.
Add to your project's .mcp.json:
{
  "mcpServers": {
    "agent-obs": {
      "command": "agent-obs",
      "args": ["server"]
    }
  }
}
Then add a project-level skill so Claude self-reports. Create .claude/skills/agent-obs/SKILL.md:
---
name: agent-obs
description: Report every tool call to agent-obs for observability tracking.
---

At the start of each task, call agent_obs_start_session with a description
of the task. After every tool call, call agent_obs_log_tool_call with the
tool name, duration, status, input summary, and output summary. When the
task is done, call agent_obs_end_session with the final status and token
counts.
Add to Cursor's MCP settings (~/.cursor/mcp.json, or Settings → MCP → Add new global MCP server):
{
  "mcpServers": {
    "agent-obs": {
      "command": "agent-obs",
      "args": ["server"]
    }
  }
}
Then add the same self-reporting instruction to your Cursor rules (.cursorrules or Settings → Rules):
After every tool call, call agent_obs_log_tool_call with the tool name, duration, status, input summary, and output summary. Start a session at the beginning of each task with agent_obs_start_session.
The MCP server mode above is the primary way to use agent-obs. The agent self-reports every action it takes — including built-in tools (Read, Write, Edit, Bash, etc.) that never travel over MCP and therefore can't be captured by a proxy. Self-reporting also captures reasoning context the wire protocol never sees: why a tool was chosen, what the agent was trying to accomplish, and how the session should be graded.
For MCP-only workloads, there's also a transparent proxy mode that requires no agent cooperation. Wrap any MCP server command and every tool invocation through it gets traced automatically:
agent-obs proxy --desc "fix login bug" -- npx @modelcontextprotocol/server-filesystem /tmp
The proxy captures tool names, arguments, results, durations, and success/failure status — but only for calls to the wrapped server. Use it as a supplement, not a replacement, for self-reporting.
All data is written to a local SQLite database in ~/.agent-observability/. No data leaves your machine.
agent-obs dashboard
# Open http://localhost:9400
# You should see a session appear after your agent runs a task
The dashboard shows:
                   ┌──────────────────────────┐
                   │     agent-obs proxy      │
                   │   (transparent capture)  │
                   │                          │
MCP Client ───────▶│ intercepts tool calls ──▶│ MCP Server
 (Claude/Cursor)   │ logs to SQLite           │  (filesystem,
                   └──────────┬───────────────┘   github, etc.)
                              │
                              ▼
                   ┌──────────────────────────┐
                   │   agent-obs server       │
                   │    (self-reporting)      │
                   │                          │
                   │ Agent calls obs_record_* │
                   │ tools directly via MCP   │
                   │ • tool calls             │
                   │ • token usage            │
                   │ • decisions              │
                   │ • grades                 │
                   └──────────┬───────────────┘
                              │
                              ▼
                   ┌──────────────────────────┐
                   │   ~/.agent-observability │
                   │       SQLite DB          │
                   │                          │
                   │  • sessions              │
                   │  • tool_calls            │
                   │  • token_usage           │
                   │  • decisions             │
                   │  • grades                │
                   └──────────┬───────────────┘
                              │
                              ▼
                   ┌──────────────────────────┐
                   │   agent-obs dashboard    │
                   │     (port 9400)          │
                   │                          │
                   │  GET  /api/sessions      │
                   │  GET  /api/sessions/:id  │
                   │  GET  /api/search?q=     │
                   │  GET  /api/stats         │
                   │  POST /api/export        │
                   └──────────────────────────┘
| Method | Path | Description |
|---|---|---|
GET | /api/sessions | List all sessions. Query params: ?limit=20&offset=0&grade=B |
GET | /api/sessions/:id | Get full session detail with all tool calls, tokens, decisions, and grades |
GET | /api/sessions/:id/tool-calls | List tool calls for a session. Query params: ?status=error&server=filesystem |
GET | /api/sessions/:id/tokens | Get token usage history for a session |
GET | /api/sessions/:id/decisions | Get decision points for a session |
GET | /api/search | Full-text search across tool call inputs/outputs. Query param: ?q=read_file |
GET | /api/stats | Aggregate statistics: total sessions, avg grade, total tokens, total cost |
POST | /api/export | Export session data as JSON. Body: { "sessionIds": ["abc123"], "format": "json" } |
GET | /api/health | Health check. Returns { "status": "ok", "dbSize": "2.4MB", "sessionCount": 47 } |
| Tool | Parameters | Returns |
|---|---|---|
obs_record_tool_call | sessionId, toolName, serverName, duration (ms), status (success/error), input, output | { "id": "call-uuid", "recorded": true } |
obs_record_token_usage | sessionId, inputTokens, outputTokens, model | { "totalTokens": 1850, "estimatedCost": "$0.023" } |
obs_record_decision | sessionId, context, options, chosen, reasoning | { "id": "decision-uuid", "recorded": true } |
obs_record_grade | sessionId, grade (A/B/C/D/F), reasoning | { "grade": "B", "recorded": true } |
obs_get_session_report | sessionId | Full session JSON with all calls, tokens, decisions, grade |
obs_list_sessions | limit, offset | Array of { id, description, grade, createdAt, tokenTotal, estimatedCost } |
read_file, execute_command, search_codesuccess or errorCosts are estimated based on published API pricing:
| Model | Input (per 1M tokens) | Output (per 1M tokens) |
|---|---|---|
| Claude 3.5 Sonnet | $3.00 | $15.00 |
| Claude 3 Opus | $15.00 | $75.00 |
| GPT-4o | $2.50 | $10.00 |
| GPT-4 Turbo | $10.00 | $30.00 |
Costs are tracked per session and displayed in the dashboard. You can add custom model pricing via ~/.agent-observability/models.json.
Every session receives a letter grade based on efficiency and correctness:
| Grade | Label | Criteria |
|---|---|---|
| A | Clean | Zero errors, minimal token waste, no unnecessary tool calls |
| B | Minor issues | Some inefficiencies, but no failures |
| C | Inefficient | Excessive token usage, redundant tool calls, recoverable errors |
| D | Risky | Significant problems — failed tool calls, high cost, wrong tools chosen |
| F | Failed | Errors prevented task completion, or agent abandoned the session |
When the agent has multiple possible actions, it can record why it chose one over another. Example:
{
  "context": "need to read a file — it could be at src/config.ts or lib/config.ts",
  "options": ["read_file src/config.ts", "glob **/config.ts", "grep 'CONFIG' *.ts"],
  "chosen": "glob **/config.ts",
  "reasoning": "File might not exist at the expected path; glob guarantees finding it regardless of location"
}
Decision points create an audit trail of agent reasoning, making it possible to understand not just what happened, but why.
Every action is timestamped and linked to a session. The audit trail answers:
Grades are assigned manually by the agent via obs_record_grade or automatically by the dashboard based on session statistics:
Grades accumulate over time. The /api/stats endpoint shows your average grade and grade distribution.
AI agents are a black box. You tell Claude Code or Cursor to fix a bug, refactor a module, or add a feature — and minutes later you have a diff. But what actually happened in between? How many tool calls did it make? How many tokens did it burn? Which files did it read? Did it try three approaches before landing on one? You have no idea.
This isn't just academic curiosity. Without observability:
Agent Observability gives you a flight recorder for every agent session. It answers: what happened, why it happened, and what it cost.
This project combines ideas from three prior projects:
AgentShelf scans a Shopify store's theme, apps, admin settings, and custom code to produce an AI readiness score. As it scans, it builds a full audit trail — every file read, every API call made, every finding logged with a timestamp and data source. Pattern adopted here: structured audit trail with per-action timestamps, data source attribution, and session-level summarization.
Veros generates synthetic longitudinal patient records (FHIR R4) and uses them to validate clinical decision support agents. Its core principle: "no trace, no answer." Every snippet of clinical reasoning produced by an AI must be traceable back to the specific data element (lab result, medication, condition) that supports it. Pattern adopted here: decision point tracking — every agent choice must cite its basis, making reasoning auditable and contestable.
MCP Observatory sits on top of Model Context Protocol servers and scores their health: uptime, response latency, tool success rate, error rate. It implements pass/fail gating — if a server's health score drops below a threshold, it's automatically excluded from the agent's available tools. Pattern adopted here: tool health scoring, session grading (A-F), and automatic degradation flags.
This open source package (agent-observability on npm) is the core engine. It's MIT licensed and will always remain free and local-first:
A cloud version (app.agentobservability.dev) is in development with additional features:
The open source package will always be able to run independently. The cloud version is additive, not a replacement.
MIT
FAQs
Trace AI agent execution: every tool call, every error, every dollar. Open source agent observability for Claude, Cursor, opencode, and any MCP-compatible agent. Local-first, free forever.
The npm package agent-obs receives a total of 55 weekly downloads. As such, agent-obs popularity was classified as not popular.
We found that agent-obs demonstrated a healthy version release cadence and project activity because the last version was released less than a year ago. It has 1 open source maintainer collaborating on the project.
Product
Socket can now send alerts and supply chain attack notifications to Microsoft Teams, with filters that route the right updates to each channel.

Security News
pnpm 12 rewrites the package manager in Rust, cutting install times by up to 90% while preserving pnpm 11 workflows and lockfiles.
Security News
Socket CTO Ahmad Nassri joins AppSec leaders at Black Hat to discuss active malware, package manager risks, and software supply chain defense.