
Security News
The Unpaid Backbone of Open Source: Solo Maintainers Face Increasing Security Demands
Solo open source maintainers face burnout and security challenges, with 60% unpaid and 60% considering quitting.
By Sarah Gooding - Sep 20, 2024
angular-calendar-heatmap
Advanced tools
Angular directive for the calendar heatmap graph representing time series data.
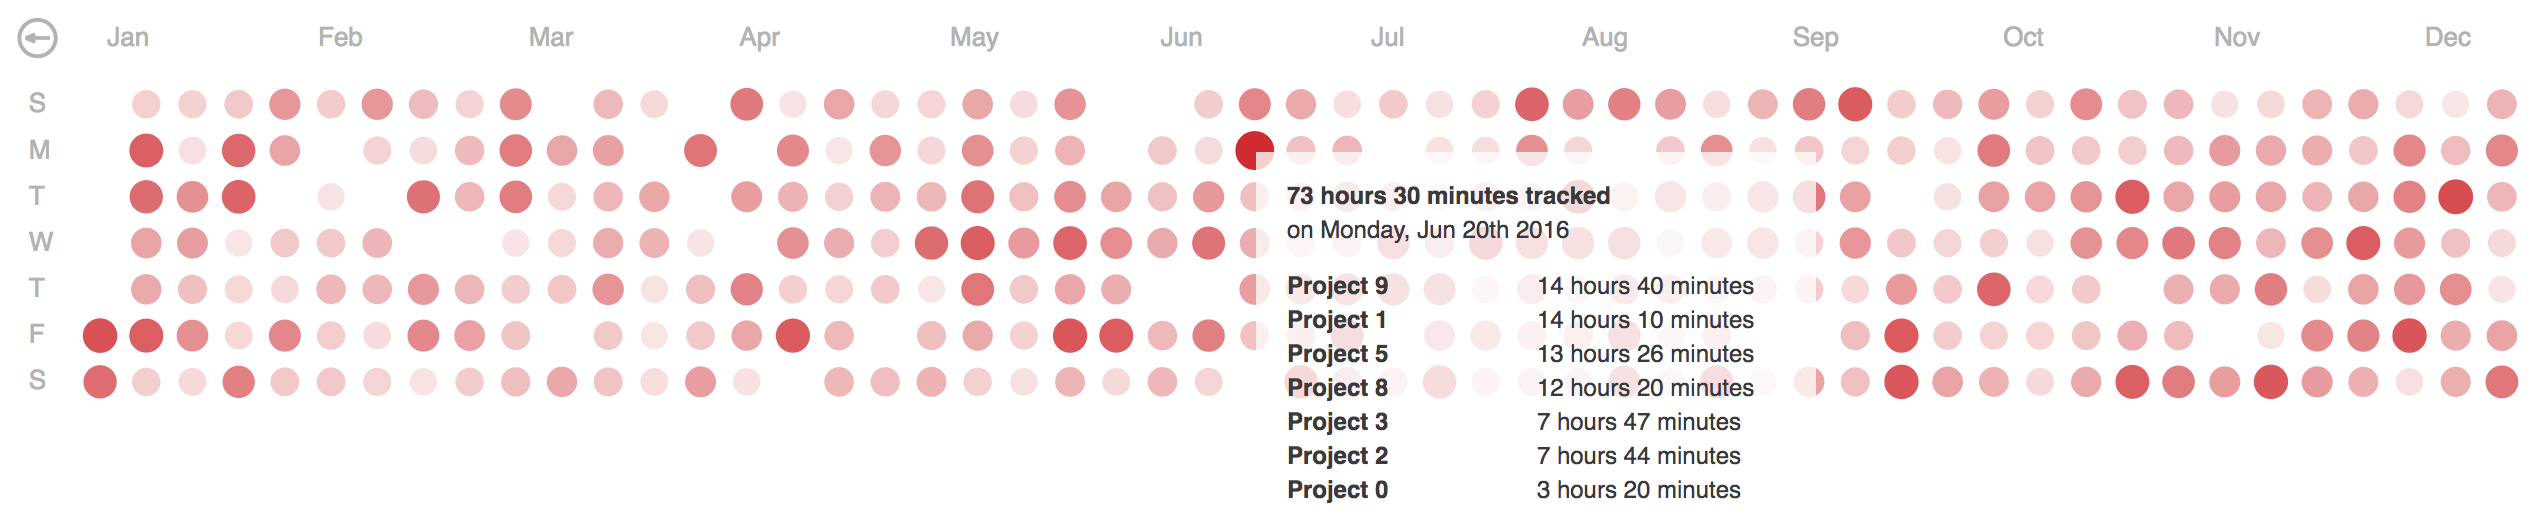
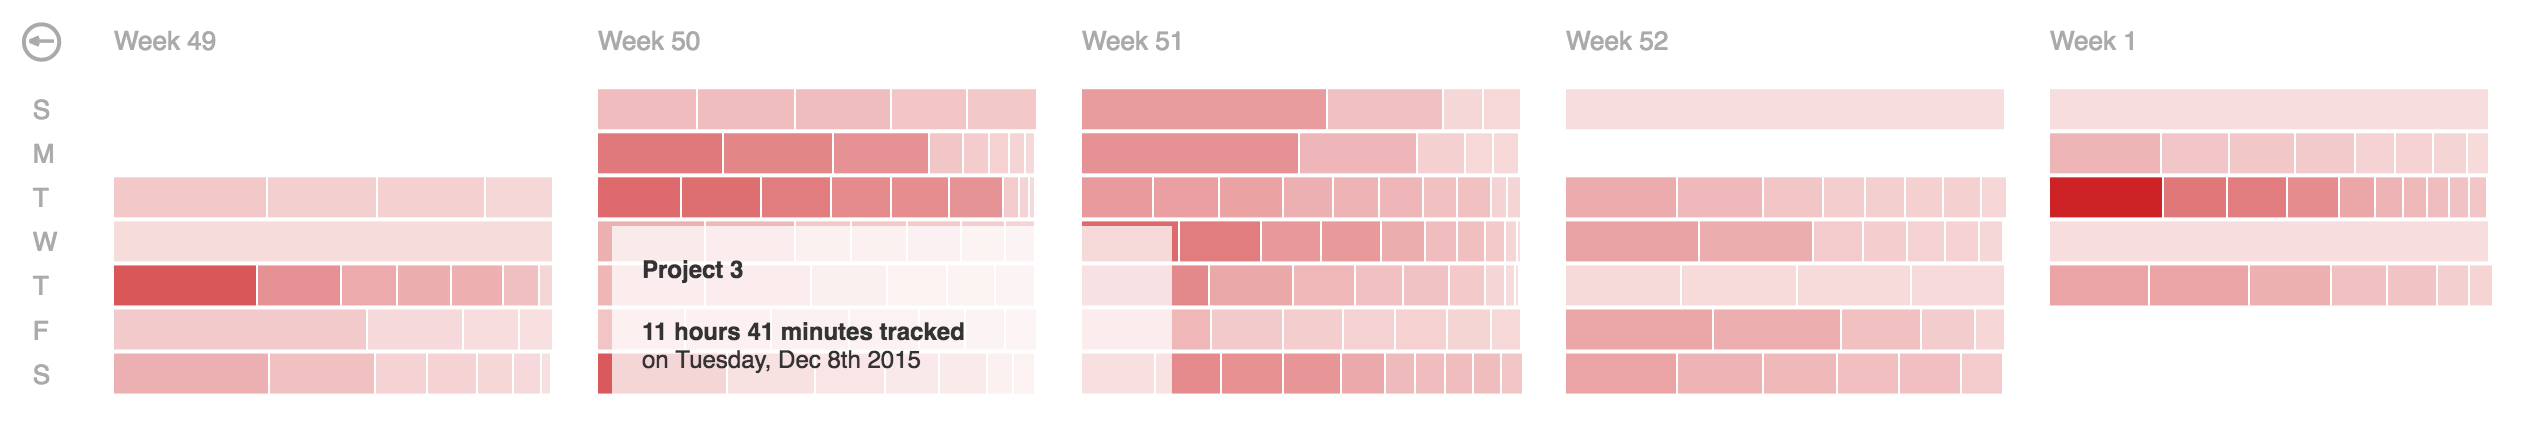
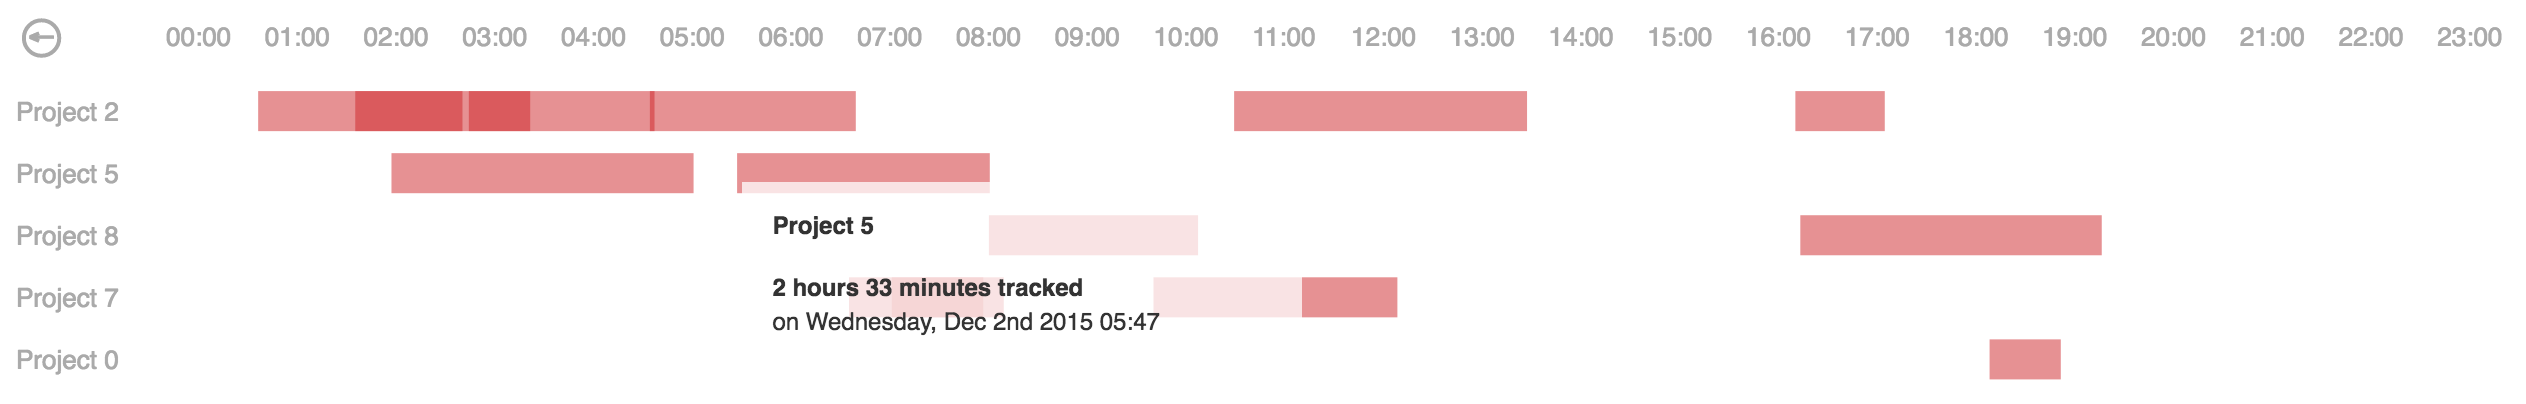
This d3.js heatmap representing time series data is used to visualize tracked time over the past year, showing details for each of the days on demand. Converted into an angular directive for your convenience :)
Inspired by Github's contribution chart.
Based on D3.js Calendar Heatmap by Darragh Kirwan
Aaand Calendar View by Mike Bostock
Click here for a live demo.

bower install angular-calendar-heatmap
Or:
npm install angular-calendar-heatmap
angular.module('myApp', [
  'g1b.calendar-heatmap',
  .....
])
<calendar-heatmap data="example_data" color="'#ff0000'" overview="'year'" handler="print"></calendar-heatmap>
| Property | Usage | Default | Required |
|---|---|---|---|
| data | Time series data from max a year back | none | yes |
| color | Theme hex color | #45ff00 | no |
| overview | Initial overview type (choices are: year, month, day) | year | no |
| handler | Handler function is fired on click of a time entry in daily overview | none | no |
Time series data for each day going 1 year back. Each day has a total time tracked (in seconds). Details, if provided, are shown in a tooltip as well as in daily overview.
var data = [{
  "date": "2016-01-01",
  "total": 17164,
  "details": [{
    "name": "Project 1",
    "date": "2016-01-01 12:30:45",
    "value": 9192
  }, {
    "name": "Project 2",
    "date": "2016-01-01 13:37:00",
    "value": 6753
  },
  .....
  {
    "name": "Project N",
    "date": "2016-01-01 17:52:41",
    "value": 1219
  }]
}]
In some cases details array could be large and in order to fit the data into the tooltip a short summary is generated with distinct projects and their total tracked time for that date.
In terms of optimization summary data can be computed server-side and passed in using the summary attribute.
And in addition to the data structure described above this would result in a summary dictionary with distinct project names and total values of tracked time in seconds, e.g.:
var data = [{
  "date": "2016-01-01",
  "total": 17164,
  "details": [.....],
  "summary": [{
    "name": "Project 1",
    "value": 9192
  }, {
    "name": "Project 2",
    "value": 6753
  },
  .....
  {
    "name": "Project N",
    "value": 1219
  }]
}]
See index.html for an example implementation with random data or click here for a live demo.
If you are looking for a plain vanilla javascript version of the heatmap, check out calendar-heatmap-graph
FAQs
Angular directive for d3.js calendar heatmap graph.
The npm package angular-calendar-heatmap receives a total of 86 weekly downloads. As such, angular-calendar-heatmap popularity was classified as not popular.
We found that angular-calendar-heatmap demonstrated a not healthy version release cadence and project activity because the last version was released a year ago. It has 1 open source maintainer collaborating on the project.
Did you know?

Socket for GitHub automatically highlights issues in each pull request and monitors the health of all your open source dependencies. Discover the contents of your packages and block harmful activity before you install or update your dependencies.
Security News
Solo open source maintainers face burnout and security challenges, with 60% unpaid and 60% considering quitting.

Security News
License exceptions modify the terms of open source licenses, impacting how software can be used, modified, and distributed. Developers should be aware of the legal implications of these exceptions.

Security News
A developer is accusing Tencent of violating the GPL by modifying a Python utility and changing its license to BSD, highlighting the importance of copyleft compliance.