

Security News
Happy Birthday, Shai-Hulud
It has been one year since Shai-Hulud made its first appearance on npm.
By Sarah Gooding - Sep 18, 2026
awesome-axis-chart
Advanced tools
The AxisChart component is the secondary encapsulation of the echarts and echarts for react components
Its original intention is that it is not flexible enough to set the content boundary and distance dimension displayed by the chart display data of ecarts chart library,
This leads to the border overflow display problem of charts for data display in different scenes,
The most important thing about AxisChart is not its configuration parameter regulation, but its internal automatic size processing and regulation function,
It is sufficient to cope with the display of various data levels so that the display of the chart does not exceed the boundary,
The various parametric configurations attached to it are not the original intention of the component creation, but the abnormal configuration to meet the wonderful needs of various project managers
它的初衷是出于对于echarts图表库的图表展示数据显示出的内容边界以及距离尺寸设置不够"灵活",
导致对于不同场景的数据显示的图表产生的边框溢出显示问题,
AxisChart最重要的不是它的配置参数调控,而是它具有内部的自动化尺寸处理调控的功能,
足以应对各种数据层次的显示而使得图表的显示没有越出边界超出显示,
它附带的各种参数化配置不是组件创始的本意,只是应对各种项目经理的奇葩需求应运而生的畸形配置
npm i awesome-axis-chart
import AxisChart, { chartData } from "awesome-axis-chart";

/** Demo1 */
function App1() {
  const chartDataTemp = cloneDeep(chartData)
  // 测试数据
  const monthAverageRainfallList: {
    // 月份
    month: string | number;
    // 系列数据类型
    type: "2018月累计降水量" | "2019月累计降水量" | "历史月累计降水量" | "未来月累计降水量" | "测试月累计降水量";
    // 数据值
    value: number;
  }[] = [
    /** 2018月累计降水量 */
    {month: 1, type: "2018月累计降水量", value: 7586},
    {month: 2, type: "2018月累计降水量", value: 8765},
    {month: 3, type: "2018月累计降水量", value: 7654},
    {month: 4, type: "2018月累计降水量", value: 6543},
    {month: 5, type: "2018月累计降水量", value: 5432},
    {month: 6, type: "2018月累计降水量", value: 5348},
    {month: 7, type: "2018月累计降水量", value: 2348},
    /** 2019月累计降水量 */
    {month: 1, type: "2019月累计降水量", value: 2348},
    {month: 2, type: "2019月累计降水量", value: 7343},
    {month: 3, type: "2019月累计降水量", value: 4372},
    {month: 4, type: "2019月累计降水量", value: 4726},
    {month: 5, type: "2019月累计降水量", value: 6632},
    {month: 6, type: "2019月累计降水量", value: 8925},
    {month: 7, type: "2019月累计降水量", value: 7925},
    /** 历史月累计降水量 */
    {month: 1, type: "历史月累计降水量", value: 5437},
    {month: 2, type: "历史月累计降水量", value: 5235},
    {month: 3, type: "历史月累计降水量", value: 3893},
    {month: 4, type: "历史月累计降水量", value: 3727},
    {month: 5, type: "历史月累计降水量", value: 2891},
    {month: 6, type: "历史月累计降水量", value: 8476},
    {month: 7, type: "历史月累计降水量", value: 8976},
    /** 未来月累计降水量 */
    {month: 1, type: "未来月累计降水量", value: 4346},
    {month: 2, type: "未来月累计降水量", value: 3612},
    {month: 3, type: "未来月累计降水量", value: 1784},
    {month: 4, type: "未来月累计降水量", value: 6538},
    {month: 5, type: "未来月累计降水量", value: 5233},
    {month: 6, type: "未来月累计降水量", value: 3437},
    {month: 7, type: "未来月累计降水量", value: 2417},
    /** 测试月累计降水量 */
    {month: 1, type: "测试月累计降水量", value: 8234},
    {month: 2, type: "测试月累计降水量", value: 7895},
    {month: 3, type: "测试月累计降水量", value: 9035},
    {month: 4, type: "测试月累计降水量", value: 6239},
    {month: 5, type: "测试月累计降水量", value: 8454},
    {month: 6, type: "测试月累计降水量", value: 7648},
    {month: 7, type: "测试月累计降水量", value: 6448},
  ];

  Object.assign(chartDataTemp, {
    data: monthAverageRainfallList.map((item, index) => {
      return [`${index}`, `${item.type}`, `${item.month}月降水量`, item.value];
    }),
  })
  // 最简单的使用
  return (
    <AxisChart
      // 默认垂直暗黑系风格
      theme="verticalDark"
      chartData={chartDataTemp}
      // 关于配置由于太多了这里不展示,具体可参考代码内部test文件夹下的demo或者组件内部文档注释
      // basicConfigOption={{ ??? }}
      subColor={[
        "#ff7043", "#ffb300", "#1de9b6", "#00d4ec",
        "#ed3e61", "#bccd07", "#04ce1c", '#058ff8',
      ]}
    />
  );
}

/** Demo2 */
function App2() {
  const chartDataTemp = cloneDeep(chartData)
  // 测试数据
  const monthAverageRainfallList: {
    // 月份
    month: string | number;
    // 18年月平均降雨量
    eighteenRainfall: number;
    // 19年月平均降雨量
    nineteenRainfall: number;
    // 历史月平均降雨量
    historyRainfall: number;
    // 未来月平均降雨量
    futureRainfall: number;
    // 测试月平均降雨量
    testRainfall: number;
  }[] = [
    {month: 1, eighteenRainfall: 7586, nineteenRainfall: 2348, historyRainfall: 5437, futureRainfall: 4346, testRainfall: 8234},
    {month: 2, eighteenRainfall: 8765, nineteenRainfall: 7343, historyRainfall: 5235, futureRainfall: 3612, testRainfall: 7895},
    {month: 3, eighteenRainfall: 7654, nineteenRainfall: 4372, historyRainfall: 3893, futureRainfall: 1784, testRainfall: 9035},
    {month: 4, eighteenRainfall: 6543, nineteenRainfall: 4726, historyRainfall: 3727, futureRainfall: 6538, testRainfall: 6239},
    {month: 5, eighteenRainfall: 5432, nineteenRainfall: 6632, historyRainfall: 2891, futureRainfall: 5233, testRainfall: 8454},
    {month: 6, eighteenRainfall: 5348, nineteenRainfall: 8925, historyRainfall: 8476, futureRainfall: 3437, testRainfall: 7648},
    {month: 7, eighteenRainfall: 2348, nineteenRainfall: 7925, historyRainfall: 8976, futureRainfall: 2417, testRainfall: 6448},
  ];

  Object.assign(chartDataTemp, {
    data: monthAverageRainfallList.reduce((preItem, item, index) => {
      // 注意:后续组件内会使用getNumbersByStrings方法进行数据提取,但是它必须要求数组第一个元素是字符串
      // 且getRangeByIndex方法提取类目数据时也需要是字符串,所以数组第三个元素必须是字符串
      // index索引5,6为添加的辅助数据(tooltip显示用,不参与图表渲染)
      const itemData: [string, string, string, number, number, number][] = [
        [`${index}`, "2018月累计降水量", `${item.month}月降水量`, item.eighteenRainfall],
        [`${index + 1}`, "2019月累计降水量", `${item.month}月降水量`, item.nineteenRainfall],
        [`${index + 2}`, "历史月累计降水量", `${item.month}月降水量`, item.historyRainfall],
        [`${index + 3}`, "未来月累计降水量", `${item.month}月降水量`, item.futureRainfall],
        [`${index + 4}`, "测试月累计降水量", `${item.month}月降水量`, item.testRainfall],
      ]
      return [...preItem, ...itemData]
    }, ([] as [string, string, string, number, number, number][])),
  })
  // 最简单的使用
  return (
    <AxisChart
      // 默认垂直暗黑系风格
      theme="verticalDark"
      chartData={chartDataTemp}
      // 关于配置由于太多了这里不展示,具体可参考代码内部test文件夹下的demo或者组件内部文档注释
      // basicConfigOption={{ ??? }}
      subColor={[
        "#ff7043", "#ffb300", "#1de9b6", "#00d4ec",
        "#ed3e61", "#bccd07", "#04ce1c", '#058ff8',
      ]}
    />
  );
}
Start this project and then run the app in the development mode. Then open http://localhost:3000 to view it in the browser. The page running effect view is as follows "Effective Demo View"

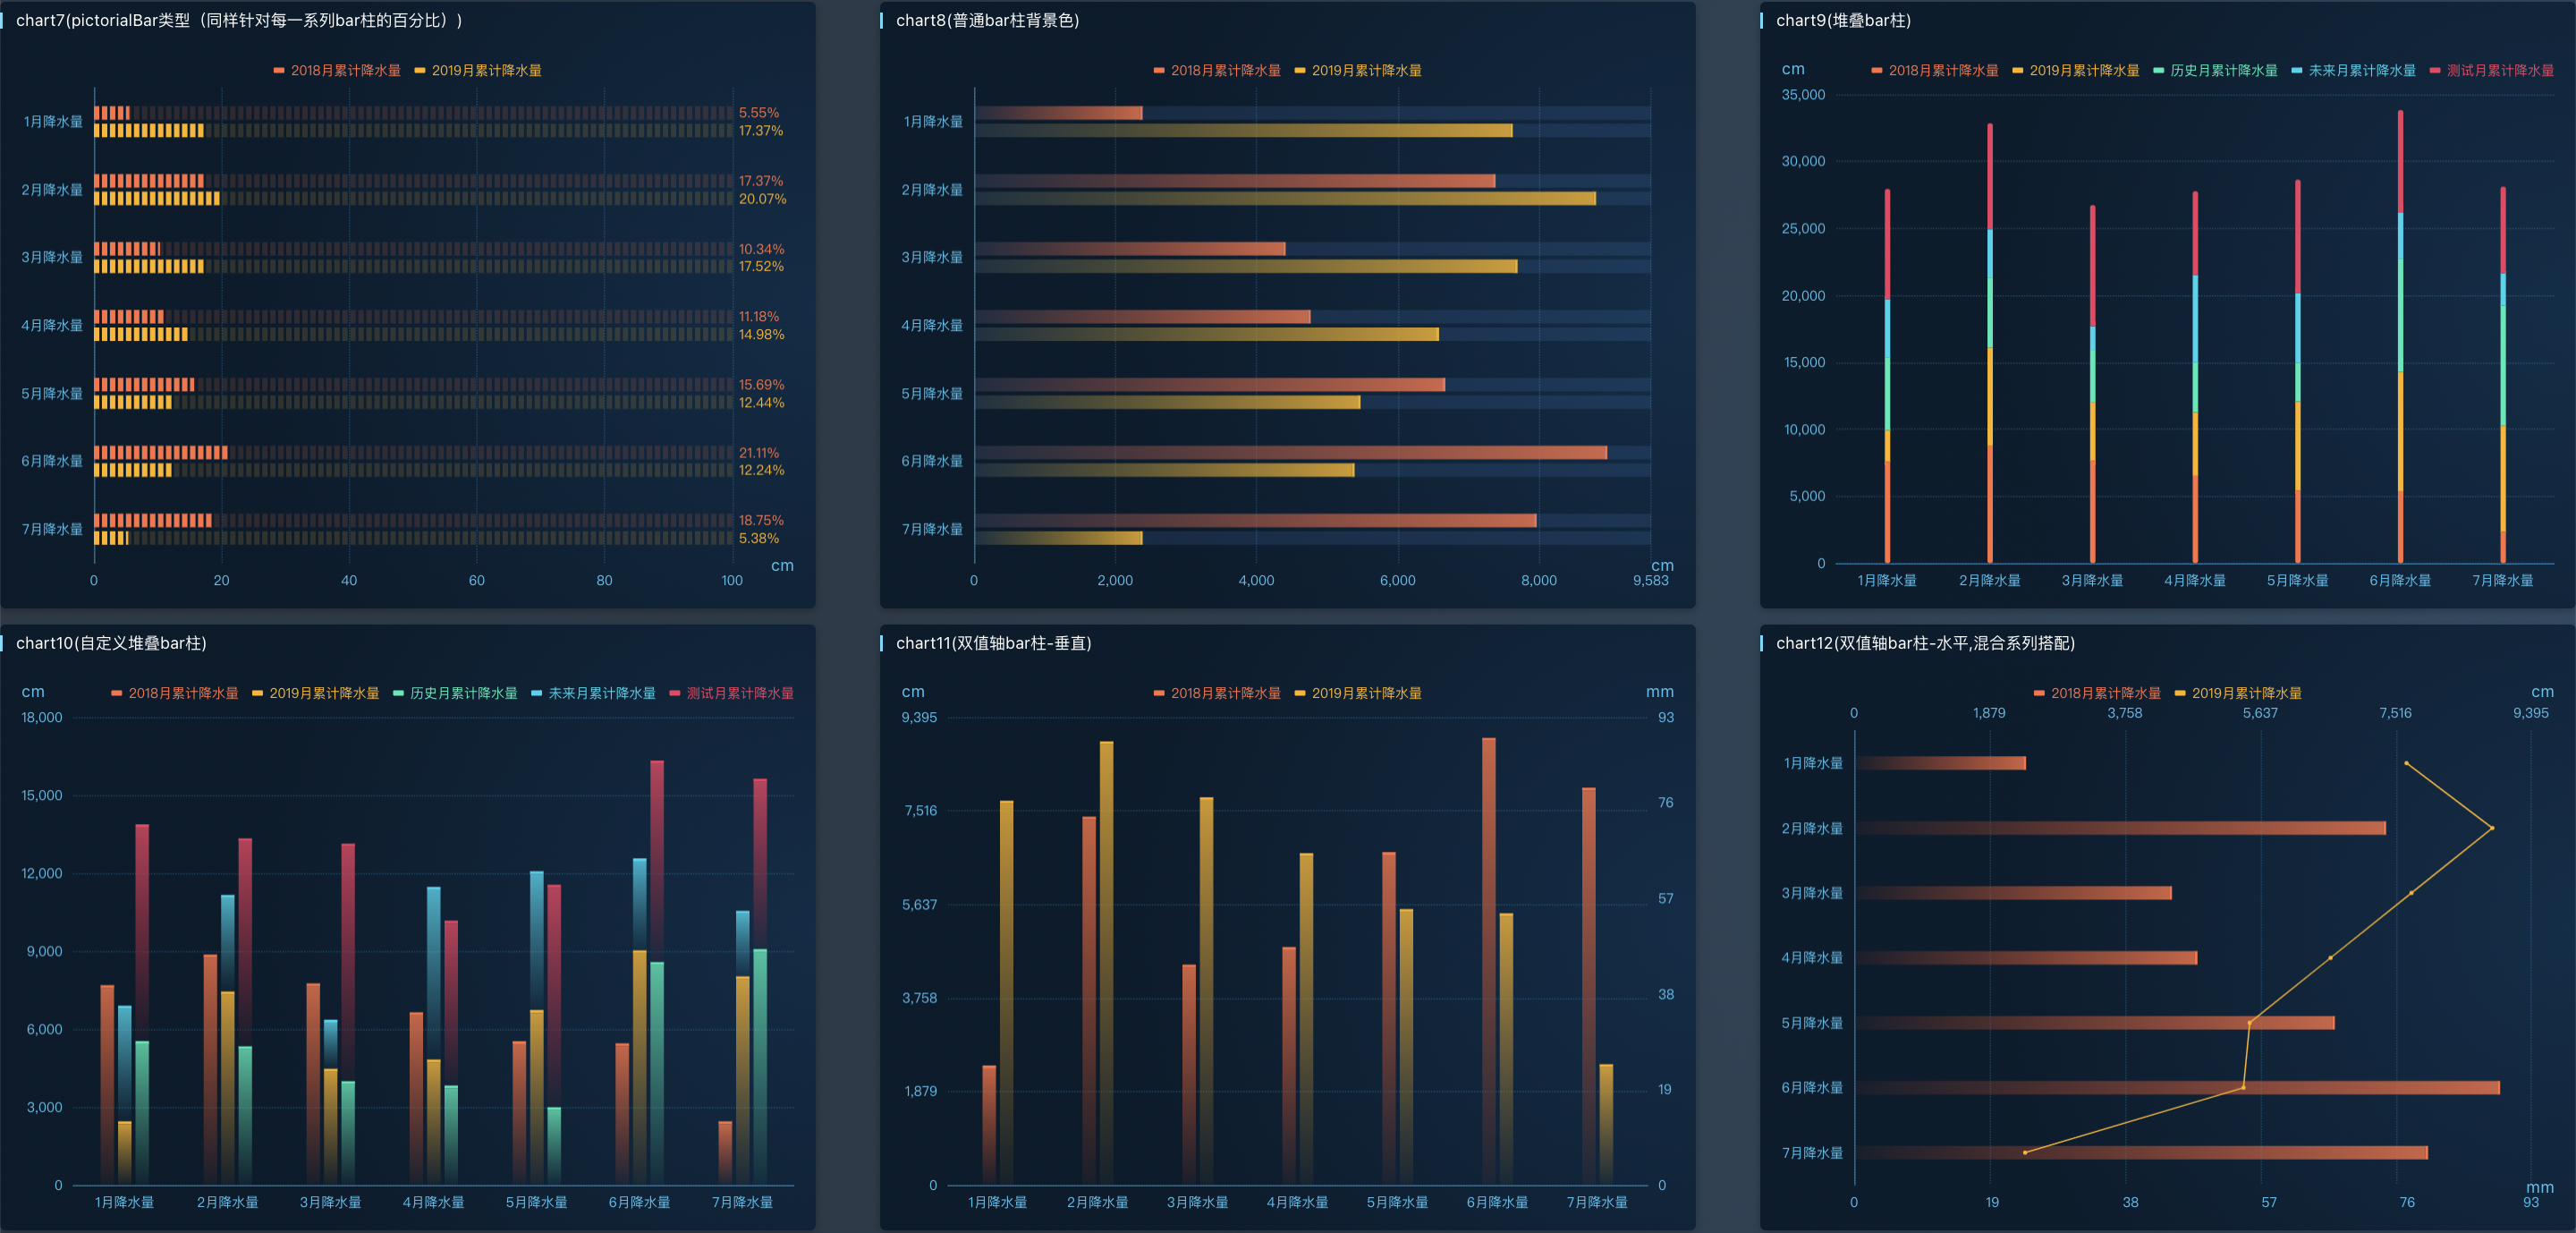


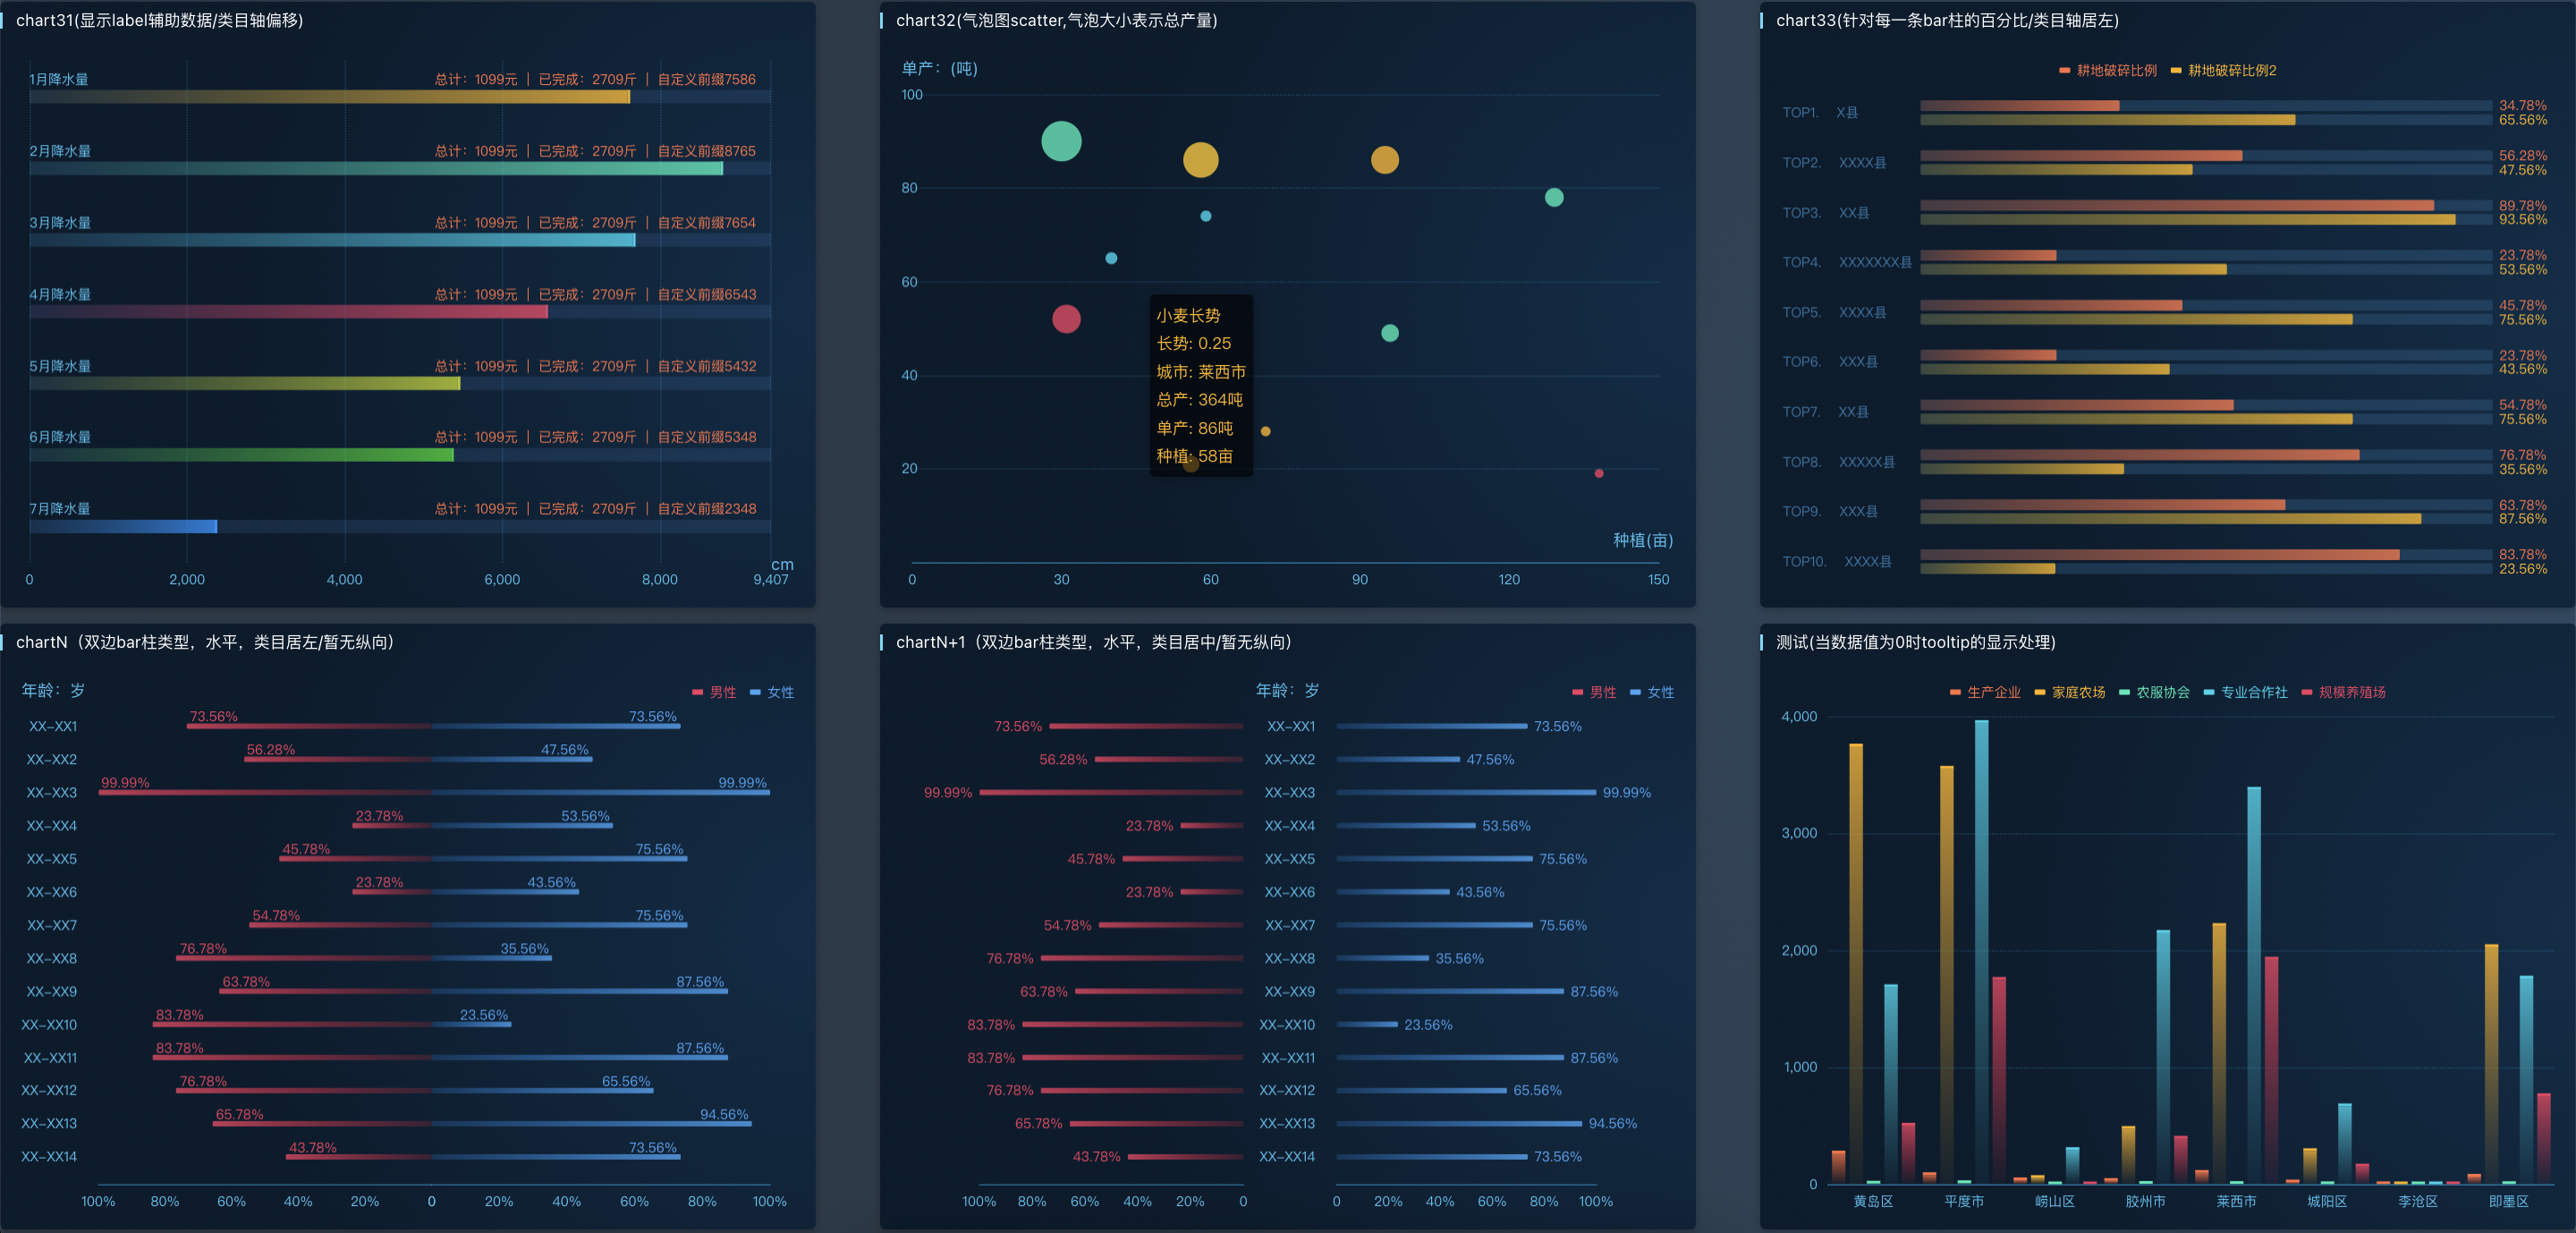
Start this project and then run the app in the development mode, Then open http://localhost:3000 to view it in the browser. View the project demo test page's source code, There are many demo examples of function introduction and code
If the project startup page does not display normally, this problem is caused by the fact that the browser has installed the react devtools extension
Find node_ modules/@pmmmwh/react-refresh-webpack-plugin/client/ReactRefreshEntry. JS file,
Find the error reporting code and directly comment the line causing the error: refreshruntime injectIntoGlobalHook(safeThis);
Then restart. This error is also closely related to the react version. Remember that the old version doesn't seem to have this problem.
In addition, for the version of webpack, there may be related version problems during startup,
Install by specified version: NPM I webpack@4.44.2 -D or remove package You can reinstall the dependency of webpm on webpi
MIT License (c) 刘善保
FAQs
The AxisChart component is the secondary encapsulation of the echarts and echarts for react components
We found that awesome-axis-chart demonstrated a not healthy version release cadence and project activity because the last version was released a year ago. It has 1 open source maintainer collaborating on the project.
Security News
It has been one year since Shai-Hulud made its first appearance on npm.

Research
/Security News
Operators behind PolinRider used a compromised GitHub account to plant malware in four development versions of a Packagist package with 700,000+ downloads.

Security News
GitHub Actions now supports cache-mode, a least-privilege control on the Actions cache aimed at the cache poisoning technique behind recent compromises.