aws-cloudwatch-chart
A node.js module to draw charts for AWS CloudWatch metrics
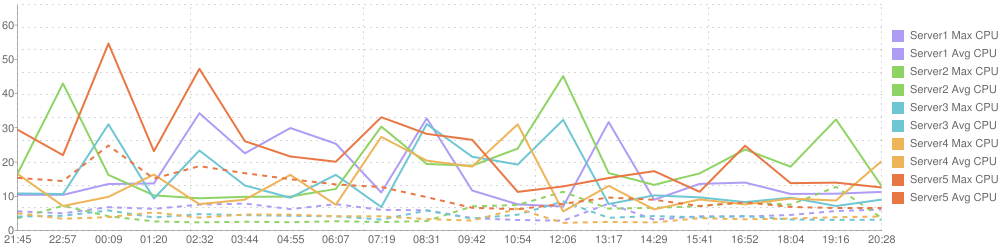
Example chart:
Installation:
npm install aws-cloudwatch-chart
Usage:
var AwsCloudWatchChart = require('aws-cloudwatch-chart');
var config = require('./config.json');
var acs = new AwsCloudWatchChart(config);
acs.getChart().then(function(chart){
chart.save('image.png').then(function(filename){
}
});
or
acs.getChart().then(function(chart){
chart.get().then(function(image){
}
});
config.json example:
{
"metrics": [
{
"title": "Server1 Max CPU",
"namespace": "AWS/EC2",
"metricName": "CPUUtilization",
"statisticValues": "Maximum",
"unit": "Percent",
"color": "af9cf4",
"thickness": 2,
"dashed": false,
"InstanceId": "i-2d55aad0",
}
],
"aws": {
"accessKeyId": "XXXXXXXXXXXXXXXXXX",
"secretAccessKey": "XXXXXX/XXXXXXXXX/XXXXXXXXXXX/XXXXXXXXX",
"region": "us-east-1"
},
"timeOffset": 1440,
"timePeriod": 60,
"chartSamples": 20,
"width": 1000,
"height":250
}
AWS Lambda ready:
Sample AWS Lambda function. Posts CloudWatch Alerts via SNS topic via Lambda function to Slack channel. And draws charts for CPUUtilization and CPUCreditBalance (for T2 instances) metrics.
Source
On GitHub
License
MIT