Security News
JSR Working Group Kicks Off with Ambitious Roadmap and Plans for Open Governance
At its inaugural meeting, the JSR Working Group outlined plans for an open governance model and a roadmap to enhance JavaScript package management.
c3-chart-maker
Advanced tools
A Node.js API and CLI tool for rendering a chart from a CSV file using a C3 spec.
THIS CODE IS NO LONGER MAINTAINED: For server side rendering of charts I recommend that you use Data-Forge Plot.
A Node.js module for rendering a chart from a CSV file using a C3 spec.
It can be used from the command line or as a code library. It's a great way to render server-side charts.
This library uses Data-Forge, Nightmare and C3.
For help please see this example repo and this post on The Data Wrangler.
If you are interested in server-side / Node.js charting and visualization my book Data Wrangling with JavaScript has a whole chapter on this.
npm install -g c3-chart-maker
c3-chart-maker <input-file> --chart=<c3-chart-file> --out=<output-image-file> [--export=<folder>] [--template=<chart-template-folder>] [--show] [--dump-chart] [--verbose]
chart       Specifies the file that defines the chart.
out         Specifies the name of the image file to output for the chart.
export      Optionally specify a folder to export the interactive chart to.
show        Optional parameter that shows the browser that renders the chart.
dump-chart  Dump the expanded chart definition to standard out for debugging.
template    Template directory that contains the HTML and CSS files for the chart. You can use this to completely override the chart template.
verbose     Enable this option for verbose debug output.
c3-chart-maker myspreadsheet.csv --chart=mychartspec.json --out=mychart.png --show --dump-chart
npm install --save c3-chart-maker
const c3ChartMaker = require('c3-chart-maker');

var inputFilePath = "your-input-file.csv"; // NOTE: This can also be a DataForge dataframe, an array of data or a path to a JSON file.
var chartTemplateFilePath = "my-chart-spec.json"; // NOTE: This can also be inline JSON or the path to a Node.js module with a function that builds the chart definition.
var outputFilePath = "your-chart-output-file.png";
var options: {
    show: true                  // Show browser used to render the chart.
    dumpChart: true,            // Dump the expanded chart definition to the console for debugging.
    export: "folder-path",      // Optionally specify a folder to export an interactive chart to.
    template: "folder-path"     // Optionally override the chart template with your own custom version.
};

c3ChartMaker(inputFilePath, chartTemplateFilePath, outputFilePath, options)
    .then(() => {
        console.log('Done');
    })
    .catch(err => {
        console.error(err);
    });
FAQs
A Node.js API and CLI tool for rendering a chart from a CSV file using a C3 spec.
The npm package c3-chart-maker receives a total of 102 weekly downloads. As such, c3-chart-maker popularity was classified as not popular.
We found that c3-chart-maker demonstrated a not healthy version release cadence and project activity because the last version was released a year ago. It has 1 open source maintainer collaborating on the project.
Did you know?

Socket for GitHub automatically highlights issues in each pull request and monitors the health of all your open source dependencies. Discover the contents of your packages and block harmful activity before you install or update your dependencies.

Security News
At its inaugural meeting, the JSR Working Group outlined plans for an open governance model and a roadmap to enhance JavaScript package management.

Security News
Research
An advanced npm supply chain attack is leveraging Ethereum smart contracts for decentralized, persistent malware control, evading traditional defenses.

Security News
Research
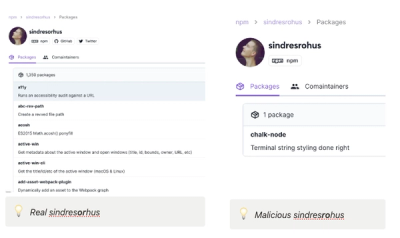
Attackers are impersonating Sindre Sorhus on npm with a fake 'chalk-node' package containing a malicious backdoor to compromise developers' projects.