Security News
OWASP 2025 Top 10 Adds Software Supply Chain Failures, Ranked Top Community Concern
OWASP’s 2025 Top 10 introduces Software Supply Chain Failures as a new category, reflecting rising concern over dependency and build system risks.
chartjs-chart-box-and-violin-plot
Advanced tools
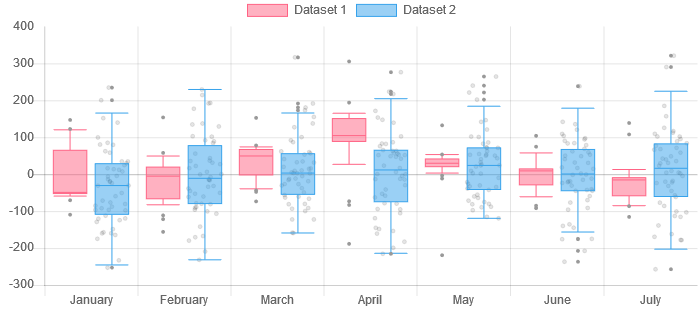
Chart.js module for charting box and violin plots. Works only with Chart.js >= 2.8.0


Please note that this project has been archived and is no longer being maintained. There is an active fork https://github.com/sgratzl/chartjs-chart-boxplot and we will also contribute our future changes to it.
npm install --save chart.js chartjs-chart-box-and-violin-plot
see Samples on Github
and CodePen
four new types: boxplot, horizontalBoxplot, violin, and horizontalViolin.
/**
 * Limit decimal digits by an optional config option
 **/
  tooltipDecimals?: number;
The boxplot element is called boxandwhiskers. The basic options are from the rectangle element. The violin element is called violin also based on the rectangle element.
interface IBaseStyling {
  /**
   * @default see rectangle
   * @scriptable
   * @indexable
   */
  backgroundColor: string;

  /**
   * @default see rectangle
   * @scriptable
   * @indexable
   */
  borderColor: string;

  /**
   * @default null takes the current borderColor
   * @scriptable
   * @indexable
   */
  medianColor: string;

  /**
   * @default 1
   * @scriptable
   * @indexable
   */
  borderWidth: number;

  /**
   * radius used to render outliers
   * @default 2
   * @scriptable
   * @indexable
   */
  outlierRadius: number;

  /**
   * @default see rectangle.backgroundColor
   * @scriptable
   * @indexable
   */
  outlierColor: string;

  /**
   * to fill color below the median line of the box
   * @default see rectangle.lowerColor
   * @scriptable
   * @indexable
   */
  lowerColor: string;

  /**
   * radius used to render items
   * @default 0 so disabled
   * @scriptable
   * @indexable
   */
  itemRadius: number;

  /**
   * item style used to render items
   * @default circle
   */
  itemStyle: 'circle'|'triangle'|'rect'|'rectRounded'|'rectRot'|'cross'|'crossRot'|'star'|'line'|'dash';

  /**
   * background color for items
   * @default see rectangle backgroundColor
   * @scriptable
   * @indexable
   */
  itemBackgroundColor: string;

  /**
   * border color for items
   * @default see rectangle backgroundColor
   * @scriptable
   * @indexable
   */
  itemBorderColor: string;

  /**
   * padding that is added around the bounding box when computing a mouse hit
   * @default 1
   * @scriptable
   * @indexable
   */
  hitPadding: number;

  /**
   * hit radius for hit test of outliers
   * @default 4
   * @scriptable
   * @indexable
   */
  outlierHitRadius: number;
}

interface IBoxPlotStyling extends IBaseStyling {
  // no extra styling options
}

interface IViolinStyling extends IBaseStyling {
  /**
  * number of sample points of the underlying KDE for creating the violin plot
  * @default 100
  */
  points: number;
}
In addition, two new scales were created arrayLinear and arrayLogarithmic. They were needed to adapt to the required data structure.
Both arrayLinear and arrayLogarithmic support the two additional options to their regular counterparts:
interface IArrayLinearScale {
  ticks: {
    /**
     * statistic measure that should be used for computing the minimal data limit
     * @default 'min'
     */
    minStats: 'min'|'q1'|'whiskerMin';

    /**
     * statistic measure that should be used for computing the maximal data limit
     * @default 'max'
     */
    maxStats: 'max'|'q3'|'whiskerMax';

    /**
     * from the R doc: this determines how far the plot ‘whiskers’ extend out from
     * the box. If coef is positive, the whiskers extend to the most extreme data
     * point which is no more than coef times the length of the box away from the
     * box. A value of zero causes the whiskers to extend to the data extremes
     * @default 1.5
     */
    coef: number;

    /**
     * the method to compute the quantiles. 7 and 'quantiles' refers to the type-7 method as used by R 'quantiles' method. 'hinges' and 'fivenum' refers to the method used by R 'boxplot.stats' method.
     * @default 7
     */
    quantiles: 7 | 'quantiles' | 'hinges' | 'fivenum' | ((sortedArr: number[]) => {min: number, q1: number, median: number, q3: number, max: number});
  };
}
Both types support that the data is given as an array of numbers number[]. The statistics will be automatically computed. In addition, specific summary data structures are supported:
interface IBaseItem {
  min: number;
  median: number;
  max: number;
  /**
   * values of the raw items used for rendering jittered background points
   */
  items?: number[];
}

interface IBoxPlotItem extends IBaseItem {
  q1: number;
  q3: number;
  whiskerMin?: number;
  whiskerMax?: number;
  /**
   * list of box plot outlier values
   */
  outliers?: number[];
}

interface IKDESamplePoint {
  /**
   * sample value
   */
  v: number;
  /**
   * sample estimation
   */
  estimate: number;
}

interface IViolinItem extends IBaseItem {
  /**
   * samples of the underlying KDE
   */
  coords: IKDESamplePoint[];
}
Note: The statistics will be cached within the array. Thus, if you manipulate the array content without creating a new instance the changes won't be reflected in the stats. See also CodePen for a comparison.
In order to simplify the customization of the tooltips, two additional tooltip callback methods are available. Internally the label callback will call the correspondig callback depending on the type.
arr = {
  options: {
    tooltips: {
      callbacks: {
        /**
         * custom callback for boxplot tooltips
         * @param item see label callback
         * @param data see label callback
         * @param stats {IBoxPlotItem} the stats of the hovered element
         * @param hoveredOutlierIndex {number} the hovered outlier index or -1 if none
         * @return {string} see label callback
         */
        boxplotLabel: function(item, data, stats, hoveredOutlierIndex) {
          return 'Custom tooltip';
        },
        /**
         * custom callback for violin tooltips
         * @param item see label callback
         * @param data see label callback
         * @param stats {IViolinItem} the stats of the hovered element
         * @return {string} see label callback
         */
        violinLabel: function(item, data, stats) {
          return 'Custom tooltip';
        },
      }
    }
  }
}
npm install
npm run build
Here is an example project based on Angular CLI with Angular 7 dependencies: https://github.com/sluger/ng-chartjs-boxplot
The incomaptibility with Webpack 4, mjs and Angular CLI can be solved by importing the chartjs boxplot library via the .js build artifact:
import "chartjs-chart-box-and-violin-plot/build/Chart.BoxPlot.js";
 This repository is part of the Target Discovery Platform (TDP). For tutorials, API docs, and more information about the build and deployment process, see the documentation page.
FAQs
Chart.js module for charting boxplots
We found that chartjs-chart-box-and-violin-plot demonstrated a not healthy version release cadence and project activity because the last version was released a year ago. It has 2 open source maintainers collaborating on the project.
Did you know?

Socket for GitHub automatically highlights issues in each pull request and monitors the health of all your open source dependencies. Discover the contents of your packages and block harmful activity before you install or update your dependencies.

Security News
OWASP’s 2025 Top 10 introduces Software Supply Chain Failures as a new category, reflecting rising concern over dependency and build system risks.

Research
/Security News
Socket researchers discovered nine malicious NuGet packages that use time-delayed payloads to crash applications and corrupt industrial control systems.

Security News
Socket CTO Ahmad Nassri discusses why supply chain attacks now target developer machines and what AI means for the future of enterprise security.