chromium-trace-analyzer
This is an analyzer for Chromium trace event files. You can get your hands on
one of these files by saving a profile from the Chrome developer tools or by
saving a trace from a Lighthouse audit. Given a trace, chromium-trace-analyzer
can:
- Summarize it, so you can get the information you need quickly.
- Filter out irrelevant tasks and events, so you can focus on the information
that's relevant to your code.
- Provide fine-grained attributions and breakdowns of tasks and events, so you
can understand where your performance is going.
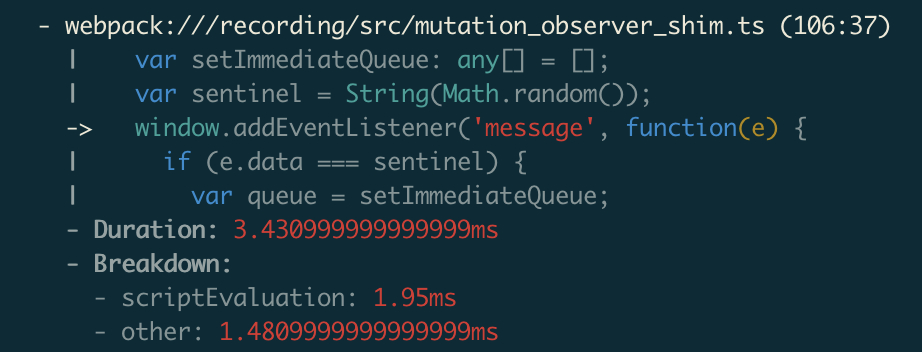
Source mapping and syntax highlighting are supported to help make the trace
summaries as readable as possible. Here's an example summary entry:
Installation
npm install -g @sethfowler/chromium-trace-analyzer
Usage
First, some quick vocabulary. chromium-trace-analyzer deals with two related
kinds of entities:
- Events are the things that actually appear in the trace file. An event
tells you about something that happened at a particular point in the
trace timeline. Events are arranged in a sequence; there's no concept of
nested events. If
foo() in foo.js calls bar() in bar.js, foo() and
bar() will show up as two separate events at different points in the
timeline, and they won't be explicitly related to each other. - Tasks are the things that Lighthouse's trace parser generates. Each task
corresponds to an event, but tasks are arranged in a tree based on the way
that events overlap on the timeline. In the example above, Lighthouse's
parser would see that
bar()'s portion of the timeline is completely inside
foo()'s, and it will make the task for bar() a child of the task for
foo().
chromium-trace-analyzer mostly works in terms of tasks since they provide more
information than the raw events.
To get a quick summary of the hottest tasks in the trace from several
perspectives:
chromium-trace-analyzer --trace profile.json
To see more tasks:
chromium-trace-analyzer --trace profile.json --top 20
To see only a specific summary (--help will give you the full list of summary
names):
chromium-trace-analyzer --trace profile.json --summary cumulative
To see a detailed play-by-play of what each task is doing (not available for the
cumulative summary):
chromium-trace-analyzer --trace profile.json --playByPlay
To focus on tasks related to a specific script, use --scriptFilter and pass a
substring of the script URL:
chromium-trace-analyzer --trace profile.json --scriptFilter foo.js
You can filter using either the original URL or the URL after source maps have
been applied. You can also optionally specify a line number, which can be used
to filter out everything but a specific function:
chromium-trace-analyzer --trace profile.json --scriptFilter original.js:123
To enable source maps, you need to specify three things:
- A substring of the script URL that you want the source map to apply to.
- The path to the source map file (.js.map) itself.
- The path to the root webpack source directory. This will be used to load the
original source code itself and include relevant snippets in the output. (Only
webpack's URL format is supported right now, unfortunately.)
You can pass that information on the command line via the colon-separated
--sourceMap option. So, if your source map setup looks like this:
- Script URL ending in
foo.js. - Source map file at
./dist/foo.js.map. - Root of the webpack source tree at
./src.
Then you'd pass a --sourceMap option that looks like this:
chromium-trace-analyzer --trace profile.json --sourceMap foo.js:./dist/foo.js.map:./src
You can provide --sourceMap multiple times to apply as many source maps as you want.
By default, the summary includes a task for each entry point into a script, even
if that entry point is nested inside another task. That means that the same
tasks may be reported multiple times in the summary - by themselves, and as a
component of their parent tasks. Often this is what you want, because you're
more interested in scripts than in the tasks themselves, but sometimes you may
want to see only top-level tasks, which correspond to spins of the event loop.
To focus on top-level tasks:
chromium-trace-analyzer --trace profile.json --topLevelOnly
Advanced usage
chromium-trace-analyzer can generate an annotated JSON version of the trace
with more detailed attribution for tasks and events. If you enable task
filtering or source mapping on the command line, those transformations will be
applied to the annotated trace as well. To generate an annotated trace:
chromium-trace-analyzer --trace profile.json --outputJsonTrace out.json
It's also possible to generate an annotated JSON version of the summary that
chromium-trace-analyzer generates. It includes far more detail than the pretty
printed output. To generated an annotated summary:
chromium-trace-analyzer --trace profile.json --outputJsonSummary out.json
It can be handy to correlate entries in the summary with individual tasks and
events in the trace. You can do this by finding the taskIds listed in the JSON
summary entries and searching for them in the JSON trace. To make it easy to do
that in your editor, if you provide the same filename for both
--outputJsonTrace and --outputJsonSummary, both the summary and the trace
will be written to the same file. For example:
chromium-trace-analyzer \
  --trace profile.json \
  --outputJsonSummary out.json \
  --outputJsonTrace out.json
References


