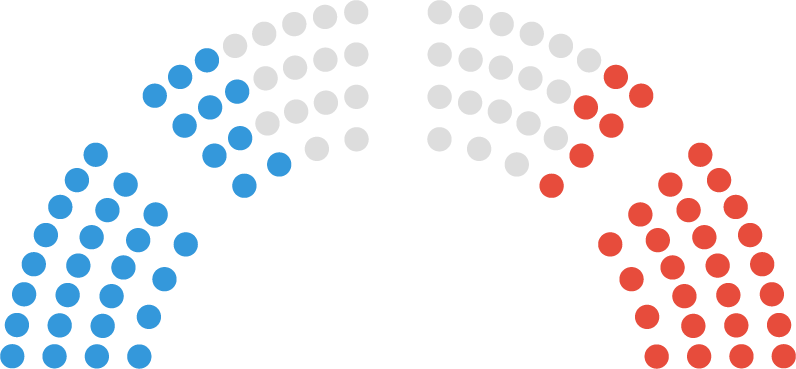
d3-parliament-chart
parliament / congress / legislature charts simplified
Installing
If you use NPM, npm install d3-parliament-chart. Otherwise, download the latest release.
API Reference
# parliamentChart(data, width)
Given an array of objects and the width of the chart, parliamentChart() creates an object that can either be used to return processed seat locations or called on a d3 selection directly. The height is automatically set to half of the width. The most basic usage of this plugin:
d3.select('g').call(d3.parliamentChart([
  { color: 'blue' }, { color: 'blue' }, { color: 'green' }, { color: 'red' }
]))
Note: if data objects contain x and y values, this library will overwrite those values. If the chart is not big enough to accommodate the given settings, it will fit a half circle and any further data points will not be assigned an x / y value.
# pc.data(data)
If data is provided, replaces the raw data in this object. If data is not provided, this function acts like a getter and adds a x and a y attribute to each element in the array, which specifies the coordinates of each point. Seats are arranged in order of their polar degrees, left to right corresponding with 0 to data length respectively.
# pc.aggregatedData(data)
This function provides a more convenient method to set an aggregated version of the data. It takes an array of objects in which each object has a seats key that specifies how many seats this party / color has. For instance, you can pass in:
[{ seats: 48, color: 'blue' }, { seats: 2, color: 'black' }, { seats: 50, color: 'red' }]
# pc.width(width)
Sets the width used for calculating the points of the parliament chart.
# pc.sections(sections)
Sets the number of sections we want to show in this parliament chart.
# pc.sectionGap(sectionGap)
Sets the gap between sections for this parliament chart.
# pc.seatRadius(seatRadius)
Sets the radius of each seat in this parliament chart.
# pc.rowHeight(rowHeight)
Sets the height of each row for this parliament chart.
# pc.debug(debug)
Takes a boolean that if true, draws a set of guidelines for what this chart is supposed to look like.
Development Mode
Development mode enables you to work on this library locally. To run this repo in development mode, run
npm run dev


