data-to-latex
A data to latex converter. Great to visualize your data.
Getting Started:
Dependencies:
Usage:
install using npm install data-to-latex
const dataToLatex = require('data-to-latex');
const exampleData = [
"Name", "Registered", "Latitude", "Longitude", "Measurements",
"Kim", "2015-04-17T12:52:08 -02:00", 53.988205, -166.008217, [20.8018, 25.4325],
"Gordon", "2014-03-14T11:18:30 -01:00", 58.7322, -142.624466, [29.8197, 19.5144],
"Mcclure", "2015-08-07T09:56:09 -02:00", 51.255166, 143.618947, [16.0908, 28.4438],
"James", "2015-08-20T01:23:03 -02:00", 51.935684, 166.887844, [28.2362, 24.8768],
"Branch", "2014-05-24T04:39:57 -02:00", 51.612881, -165.472281, [28.3879, 21.2844]
];
let dataMatrix = dataToLatex.formattedTabular(exampleData, 5);
let wrappedMatrix = dataToLatex.tableWrap(dataMatrix, 'Weatherstations');
let doc = new dataToLatex.Document(wrappedMatrix);
console.log(doc.toString());
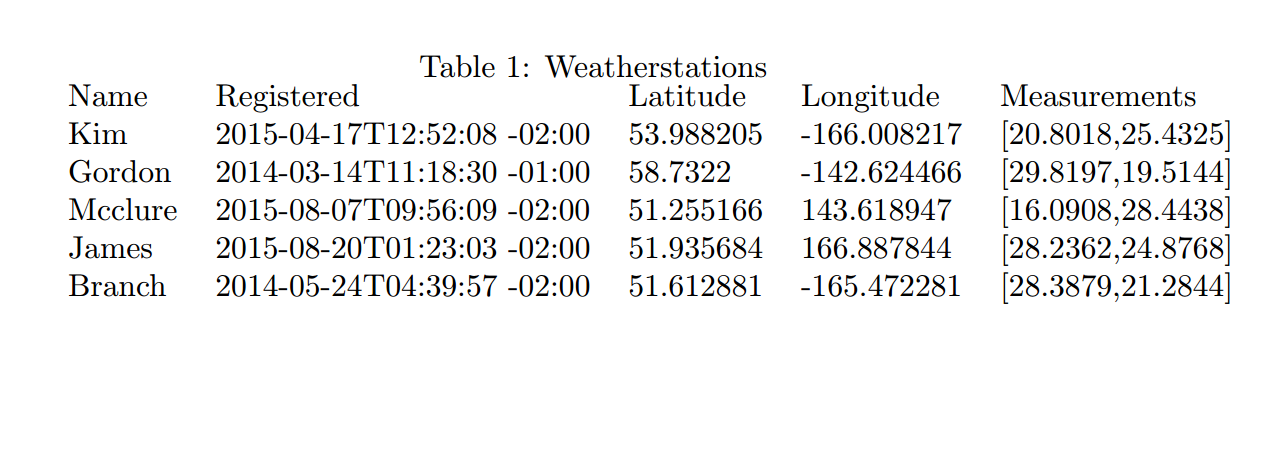
Would return Latex Result:
\documentclass[10pt,a4paper]{article}
\usepackage[utf8]{inputenc}
\usepackage{amsmath}
\usepackage{amsfonts}
\usepackage{amssymb}
\begin{document}
\begin{table}[]
\caption{Weatherstations}
\begin{tabular}{lllll}
Name & Registered & Latitude & Longitude & Measurements \\
Kim & 2015-04-17T12:52:08 -02:00 & 53.988205 & -166.008217 & [20.8018,25.4325] \\
Gordon & 2014-03-14T11:18:30 -01:00 & 58.7322 & -142.624466 & [29.8197,19.5144] \\
Mcclure & 2015-08-07T09:56:09 -02:00 & 51.255166 & 143.618947 & [16.0908,28.4438] \\
James & 2015-08-20T01:23:03 -02:00 & 51.935684 & 166.887844 & [28.2362,24.8768] \\
Branch & 2014-05-24T04:39:57 -02:00 & 51.612881 & -165.472281 & [28.3879,21.2844]
\end{tabular}
\end{table}
\end{document}
Pdf file:
Working with options
const dataToLatex = require('data-to-latex');
let exampleData = [
"Name", "Registered", "Latitude", "Longitude", "Measurements",
"Kim", "2015-04-17T12:52:08 -02:00", 53.988205, -166.008217, [20.8018, 25.4325],
"Gordon", "2014-03-14T11:18:30 -01:00", 58.7322, -142.624466, [29.8197, 19.5144],
"Mcclure", "2015-08-07T09:56:09 -02:00", 51.255166, 143.618947, [16.0908, 28.4438],
"James", "2015-08-20T01:23:03 -02:00", 51.935684, 166.887844, [28.2362, 24.8768],
"Branch", "2014-05-24T04:39:57 -02:00", 51.612881, -165.472281, [28.3879, 21.2844]
];
exampleData = exampleData.map(function (item) {
if(Array.isArray(item)){
return dataToLatex.formattedTabular(item, 2, {
vLines: [false, true, false]
});
}else{
return item;
}
});
let tabularOptions = {
vLines: (new Array(6)).fill(true),
hLines: (new Array(7)).fill(true)
};
let dataMatrix = dataToLatex.formattedTabular(exampleData, 5, tabularOptions);
let wrappedMatrix = dataToLatex.tableWrap(dataMatrix, 'Weatherstations', {
center: true
});
let doc = new dataToLatex.Document(wrappedMatrix, {
class: ['report'],
options: ['11pt'],
packages: [
{
name: ['inputenc'],
options: ['utf8']
},
{
name: ['graphicx']
}
]
});
console.log(doc.toString());
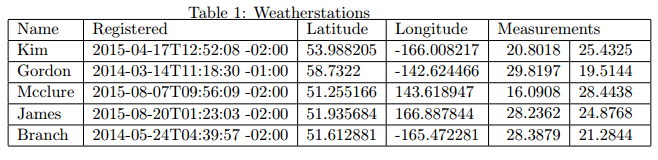
Would return Latex result:
\documentclass[11pt]{article}
\usepackage[utf8]{inputenc}
\usepackage{graphicx}
\begin{document}
\begin{table}[]
\centering
\caption{Weatherstations}
\begin{tabular}{|l|l|l|l|l|}
\hline
Name & Registered & Latitude & Longitude & Measurements \\ \hline
Kim & 2015-04-17T12:52:08 -02:00 & 53.988205 & -166.008217 & \begin{tabular}{l|l}
20.8018 & 25.4325
\end{tabular}
 \\ \hline
Gordon & 2014-03-14T11:18:30 -01:00 & 58.7322 & -142.624466 & \begin{tabular}{l|l}
29.8197 & 19.5144
\end{tabular}
 \\ \hline
Mcclure & 2015-08-07T09:56:09 -02:00 & 51.255166 & 143.618947 & \begin{tabular}{l|l}
16.0908 & 28.4438
\end{tabular}
 \\ \hline
James & 2015-08-20T01:23:03 -02:00 & 51.935684 & 166.887844 & \begin{tabular}{l|l}
28.2362 & 24.8768
\end{tabular}
 \\ \hline
Branch & 2014-05-24T04:39:57 -02:00 & 51.612881 & -165.472281 & \begin{tabular}{l|l}
28.3879 & 21.2844
\end{tabular}
 \\ \hline
\end{tabular}
\end{table}
\end{document}
Pdf file: (Note the sub-tabular in the Measurements column)
Documentation:
Project


