Security News
GitHub Removes Malicious Pull Requests Targeting Open Source Repositories
GitHub removed 27 malicious pull requests attempting to inject harmful code across multiple open source repositories, in another round of low-effort attacks.
debug-level
Advanced tools
debug with levels
A universal JavaScript logging/ debugging utility which works in node and
browsers.
It behaves similar to the popular debug module but adds additional
log levels.
Prints colored and human readable output for development and bunyan like
JSON for production environments.
Fully typed with JSDocs and Typescript.
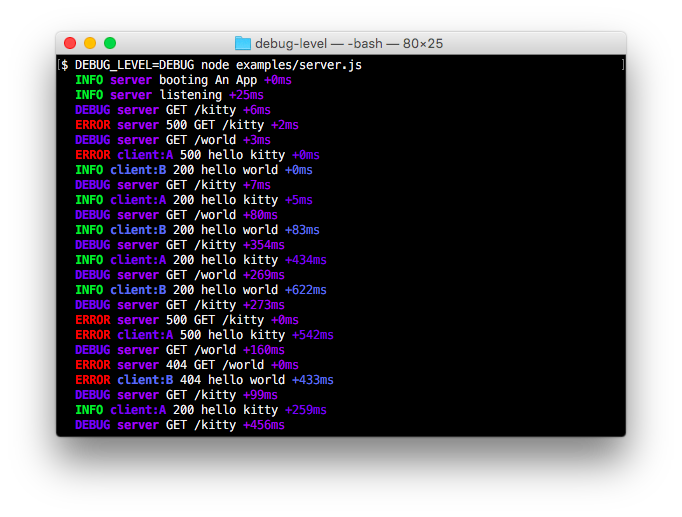
human readable format for development

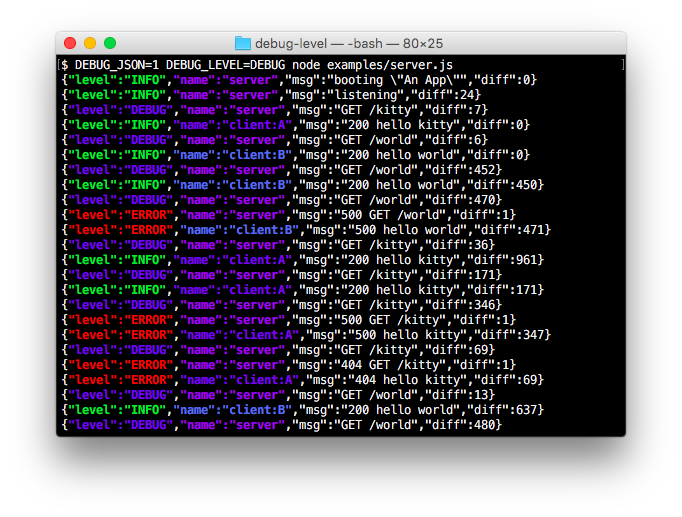
machine readable with colors

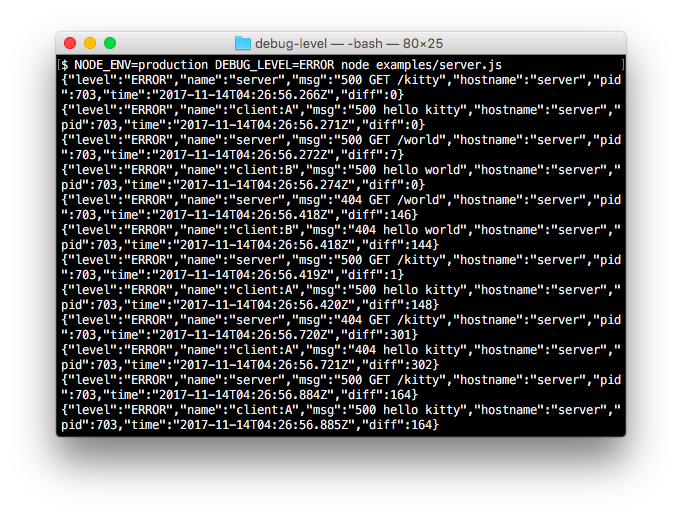
machine readable for production use

Table of Contents
$ npm install --save debug-level
debug-level provides 7 log levels which are TRACE, DEBUG, INFO, WARN, ERROR,
FATAL and OFF.
Each level has a corresponding method DEBUG -> log.debug ... FATAL -->
log.fatal which shall be used to indicated the level to log.
The characters %s, %d, %i, %f, %j, %o, %O, %% are supported
formatters when
given in the first argument.
// ESM
import { Log, logger } from 'debug-level'
// Commonjs
const { Log, logger } = require('debug-level')

// creates a logger for <namespace> `test`
const log = new Log('test')
// or using a global Log instance
const log = logger('test')

log.fatal(new Error('fatal'))        // logs an Error at level FATAL
log.error(new Error('boom'))         // logs an Error at level ERROR
log.warn('huh %o', {ghost: 'rider'}) // logs a formatted object at level WARN
log.info('%s world', 'hello')        // logs a formatted string at level INFO
log.debug({object: 1})               // logs an object at level DEBUG
log.trace('hi')                      // logs a string at level TRACE
log.log('always logs')               // always logs regardless of set level
Running levels.js without environment variables will show no output (apart
from log.log()). Setting DEBUG_LEVEL only shows all lines with their
respective level. Combined with DEBUG, using comma separated
namespaces, only those log lines with matching namespace and
level get logged.
The following table gives an overview of possible combinations:
| DEBUG_LEVEL | DEBUG | Output |
|---|---|---|
| -- | -- | no output |
| FATAL | -- | logs only log.fatal |
| ERROR | -- | log.fatal, log.error |
| WARN | -- | log.fatal, log.error, log.warn |
| INFO | -- | log.fatal, log.error, log.warn and log.info |
| DEBUG | -- | log.fatal, log.error, log.warn, log.info and log.debug |
| TRACE | -- | log.fatal, log.error, log.warn, log.info, log.debug and log.trace |
| -- | <namespaces> | log.fatal, to log.debug which apply to <namespaces>. Same behavior as debug. |
| FATAL | <namespaces> | log.fatal for all <namespaces> only |
| ERROR | <namespaces> | log.fatal, log.error for <namespaces> only |
| WARN | <namespaces> | log.fatal, to log.warn for <namespaces> only |
| INFO | <namespaces> | log.fatal, to log.info for <namespaces> only |
| DEBUG | <namespaces> | log.fatal, to log.debug for <namespaces> only |
| TRACE | <namespaces> | log.fatal, to log.trace for <namespaces> only |
| -- | ERROR:n1,DEBUG:n2,FATAL:* | Logs namespace n1 at level ERROR, namespace n2 at level DEBUG and all other namespaces (*) at level FATAL |
| FATAL | ERROR:n1,n2 | Logs n1 at level ERROR, n2 at level FATAL. All other namespaces will NOT get logged |
Run the server.js example with different settings:
No output
$ node examples/server.js
Logging .info and .error
$ DEBUG_LEVEL=INFO node examples/server.js
Logging .error for server only
$ DEBUG_LEVEL=ERROR DEBUG=server node examples/server.js
Logging .error in production mode (JSON without colors)
$ NODE_ENV=production DEBUG_LEVEL=ERROR node examples/server.js
Behavior is as with debug.
$ DEBUG=server,client:A node examples/server.js
Log server at level INFO, and all other modules at level ERROR
$ DEBUG=INFO:server,ERROR:* node examples/server.js
Common
| Setting | Values | Description |
|---|---|---|
| DEBUG | Enables/disables specific debugging namespaces | |
| DEBUG_LEVEL | ERROR, WARN, INFO, DEBUG | sets debug level |
| DEBUG_COLORS | true/false | display colors (if supported) |
Node only
| Setting | Values | NODE_ENV=development | Description |
|---|---|---|---|
| DEBUG_JSON | true/false | false | use JSON format instead of string based log |
| DEBUG_SERVERINFO | true/false | false | adds server information like pid and hostname |
| DEBUG_TIMESTAMP | iso/epoch/unix | undefined | datetime format |
| DEBUG_LEVEL_NUMBERS | true/false | false | log levels as numbers |
For NODE_ENV !== 'development' the default logging is in JSON format using serverinfo and iso date.
Browsers only
| Setting | Values | Description |
|---|---|---|
| DEBUG_URL | URL | log in JSON format to server (needs middleware.js at the server side) |
In the browser localStorage is used to set/save the settings.
E.g. to enable level ERROR an all namespaces type in console and refresh your page/ app:
localStorage.DEBUG_LEVEL='ERROR'
localStorage.DEBUG='*'
You may set the global log options with:
import fs from 'fs'
import { Log } from 'debug-level'

// log into file instead of process.stderr
const stream = fs.createWriteStream('./my.log')

// The options will be set for all Loggers...
Log.options({
  level: 'DEBUG',
  json: true,
  levelNumbers: false,
  serverinfo: true,
  timestamp: 'epoch',
  colors: false,
  stream,
  serializers: {
    err: Log.serializers.err // default error serializer is always set
  }
})
const log = new Log('my:namespace')

log.debug({ object: 1 }) // ...
| Option name | Setting | env | Type | Description |
|---|---|---|---|---|
| level | DEBUG_LEVEL | both | String | |
| namespaces | DEBUG | both | String | |
| json | DEBUG_JSON | node | Boolean | |
| spaces | DEBUG_SPACES | node | Number | JSON spaces |
| splitLine | DEBUG_SPLIT_LINE | node | Boolean | split lines for pretty, debug like, output |
| timestamp | DEBUG_TIMESTAMP | node | String | Set null/iso/unix/epoch timestamp format |
| colors | DEBUG_COLORS | both | Boolean | |
| stream | -- | node | Stream | output stream (defaults to process.stderr) |
| sonic | DEBUG_SONIC | node | Boolean | fast buffered writer |
| sonicLength | DEBUG_SONIC_LENGTH | node | number | min size of buffer in byte (default is 4096) |
| sonicFlushMs | DEBUG_SONIC_FLUSH_MS | node | number | flush after each x ms (default is 1000) |
| toJson | -- | node | Function | custom json serializer |
| serializers | -- | both | Object | serializers by keys |
| url | DEBUG_URL | browser | String |
Consider using a tool like logrotate to rotate the log-file.
$ node server.js 2> /var/log/server.log
To rotate the file with logrotate, add the following to /etc/logrotate.d/server:
/var/log/server.log {
  su root
  daily
  rotate 7
  delaycompress
  compress
  notifempty
  missingok
  copytruncate
}
Ensure that logrotate is running as a service on startup:
$ sudo service enable logrotate
To serialize top-level object keys you may use standard or custom functions.
Per default a serializer for key err is provided in node and browser.
// custom serialize function for key `my`
const mySerializer = function (val) {
  if (typeof val !== 'object' || !val) return
  const { foo } = val
  return foo
}

const log = new Log('foobar', { serializers: { my: mySerializer }})

const my = { foo: 'bar', sense: 42 }
log.info({ my })
//> INFO foobar {my: 'bar'} +0ms
(From bunyan)
FATAL: The service/app is going to stop or becomes unusable.
An operator should definitely look into this soon.ERROR: Fatal for a particular request, but the service/app continues
servicing. An operator should look at this soon(ish)WARN: A note on something that should probably be looked at by an operator
eventually.INFO: Detail on regular operation.DEBUG: Anything else, i.e. too verbose to be included in INFO level.TRACE: Trace level.Namespaces select dedicated packages for logging (check
Conventions) considering the level selected with DEBUG_LEVEL.
To choose a different log-level prefix the namespace with the level to be set
for that namespace.
E.g. to log all packages on level FATAL, test on ERROR, log:A on WARN.
As a side-effect * will also cause all modules using debug being
logged.
$ DEBUG_LEVEL=FATAL DEBUG=ERROR:test,WARN:log:A,* node examples/levels.js
  ERROR test Error: boom
  FATAL test fatal test +7ms
  WARN log:A huh {"ghost":"rider"} +0ms
  ERROR log:A Error: baam
  FATAL log:A fatal A +1ms
  FATAL log:B fatal B +0ms
  using-debug using debug +0ms
  using-debug:A using debug - feature A +1ms
So maybe consider using DEBUG=...,FATAL:* instead:
$ DEBUG=ERROR:test,WARN:log:A,FATAL:*,using-debug:* node examples/levels.js
  ERROR test Error: boom
  FATAL test fatal test +7ms
  WARN log:A huh {"ghost":"rider"} +0ms
  ERROR log:A Error: baam
  FATAL log:A fatal A +1ms
  FATAL log:B fatal B +0ms
  using-debug:A using debug - feature A +1ms
(from debug)
If you're using this in one or more of your libraries, you should use the name
of your library so that developers may toggle debugging as desired without
guessing names. If you have more than one debuggers you should prefix them with
your package name and use ":" to separate features. For example bodyParser
from Connect would then be connect:bodyParser. If you append a * to the end
of your name, it will always be enabled regardless of the setting of the DEBUG
environment variable. You can then use it for normal output as well as debug
output.
(from debug)
The * character may be used as a wildcard. Suppose for example your library
has debuggers named connect:bodyParser, connect:compress, connect:session,
instead of listing all three with
DEBUG=connect:bodyParser,connect:compress,connect:session, you may simply do
DEBUG=connect:*, or to run everything using this module simply use DEBUG=*.
You can also exclude specific debuggers by prefixing them with a - character.
For example, DEBUG=*,-connect:* would include all debuggers except those
starting with connect:.
debug-level supports two types of outputs
NODE_ENV=development. Can be forced using DEBUG_JSON=0DEBUG_JSON=1When using %j, %o, %O all will expand to %j JSON, so there is no
difference when using in node.
Nonetheless it is not recommended to use these formatters for logging errors and objects as this complicates later log inspection.
Each log records into a single JSON stringified line.
Core fields are:
level: One of the six log levels.name: The name of the namespace logged.msg: A message which should give reason for logging the line.hostname: Hostname of the server. (Requires option serverinfo)pid: PID of the logged process. (Requires option serverinfo).time: Timestamp (Suppress with option timestamp='').diff: Diff-time in milliseconds.When logging a message string, number or a formatted string it will show up under msg like:
log.debug('a %s, a number %d, an %o and %j', 'string', 1.2, {object: 1}, {NOT: 'RECOMMENDED'})
// >
{ "level": "DEBUG",           // log level
  "name": "package:feature",  // the namespace of the logger
  "msg": "a string, a number 1.2, an {\"object\":1} and {\"NOT\":\"RECOMMENDED\"}", // the formatted message
  "hostname": "server",       // server hostname
  "pid": 8310,                // process pid
  "time": "2017-11-08T21:01:00.025Z", // timestamp as ISOString
  "diff": 5                   // difftime in ms
}
Objects without formatters get assigned, arrays will show up under arr:
log.info({object: 1}, {json: true}, [1, 2, 3], '%s #%d', 'message', 1)
// >
{ "level": "INFO",
  "name": "package:feature",
    "msg": "message #1"
  "object": 1,
    "json": true,
  "arr": [1,2,3],
  "time": "2017-11-09T21:09:49.482Z",
  "diff": 0
}
An error gets logged under err
const err = new TypeError('bam')
err.status = 500
log.error(err, {object: 1}) // you may add an additional object
// >
{ "level":"ERROR",
  "name":"package:feature",
    "msg":"bam",
  "err": { // the error object
    "name":"TypeError",
    "stack":"Error: bam\n    at Object.<anonymous> (...\n    at bootstrap_node.js:608:3",
    "status": 500
  },
  "object": 1,
  "time":"2017-11-09T21:16:16.764Z",
  "diff":0
}
If logging an object you may define a toJSON() function on that object to
change proper logging of the object itself:
import { Log } from 'debug-level'
const log = new Log('*')

function reqToJSON () {
  const {ip, method, url} = this
  return {ip, method, url}
}

// assume a request obj
const req = {
  method: 'GET', url: '/path', ip: '10.10.10.10',
  headers: {'user-agent': 'Custom/2.0'}, connection: {/* ... */}
}
req.toJSON = reqToJSON.bind(req)

log.debug({req: req})
//> DEBUG * {"req":{"ip":"10.10.10.10","method":"GET","url":"/path"}} +0ms
Some packages may use console.log statements which you may wish to log with
debug-level as well.
By standard levels are assigned the same way as console does. E.g.
console.debug is assigned to level DEBUG, console.error to ERROR.
You may explicitly assign console.log to a log level by attributing e.g. { level4log: 'INFO' }
import { Log } from 'debug-level'

// standard - namespace is `console`
Log.wrapConsole()

// with custom namespace and console.log at level INFO
Log.wrapConsole('my-console', {level4log: 'INFO'})
For node only. A lot of packages use the popular debug package. To write the output in JSON with this package you may wrap those log statements.
import { Log } from 'debug-level'

Log.wrapDebug()
Do not forget to add the debug package with npm i debug within your package.
For node only. To handle exit events like
unhandledRejection
and uncaughtException
add Log.handleExitEvents() somewhere in your code. This with log the error at
level FATAL and exit the process with code 1.
// standard - namespace is `exit`
Log.handleExitEvents()

// with custom namespace
Log.handleExitEvents('process-exit')
To log http requests/ responses you can enable the httpLogs middleware in your
express/ connect server.
import express from 'express'
import { httpLogs } from 'debug-level'

const app = express()
app.use(httpLogs('my-module:http'))
Request and Response are logged with the built in reqSerializer and
resSerializer.
Additionally a request-id is set on req.id to allow for building associations
on logs containing that same id. On each request a new id is generated.
Use { customGenerateRequestId } in options, to overwrite the built-in method.
Example using above code
curl "http://localhost"
---
{
  "level": "INFO",
  "name": "my-module:http",
  "diff": 0,
  "req": {
    "id": "1021",
    "method": "GET",
    "url": "/",
    "remoteAddress": "::1",
    "remotePort": 56259,
    "headers": {
      "host": "localhost",
      "connection": "close"
    }
  },
  "res": {
    "headers": {},
    "statusCode": 200,
    "ms": 1
  }
}
To log debug messages from the browser on your server you can enable a logger middleware in your express/ connect server.
const app = require('express')()
const { browserLogs } = require('debug-level')

app.use('./debug-level', browserLogs({ maxSize: 100 }))
...
In your single page application use:
import { Log } from 'debug-level'

localStorage.setItem('DEBUG_URL', '/debug-level')
localStorage.setItem('DEBUG', 'myApp*')
// ...
const log = new Log('myApp')

log.debug('my first %s', 'logline')
Check example at examples/app. To run it use:
npm run example
and open http://localhost:3000
debug-level supports logging in ECS format in case you use the ELK stack for log monitoring.
Per default err, req, res serializers are available.
import { LogEcs } from 'debug-level'

const log = new LogEcs('foobar')

log.fatal(new Error('fatal')) // logs an Error at level FATAL
//> {"log":{"level":"FATAL","logger":"foobar","diff_ms":0},"message":"fatal","@timestamp":"2023-07-06T18:40:25.154Z","error":{"type":"Error","message":"fatal","stack_trace":"Error: fatal\\n    at file:///logecs.js:6:11\\n    at ModuleJob.run (node:internal/modules/esm/module_job:194:25)"}}
httpLogs, logger and browserLogs allow overwriting the standard Log
class in order to use ECS logging.
import { LogEcs, httpLogs } from 'debug-level'

const logHandler = httpLogs('my-pkg:http', { Log: LogEcs })

// use then e.g. in express app
app.use(logHandler)
import { LogEcs, logger } from 'debug-level'

const log = logger('my-pkg:topic', { Log: LogEcs })

log.error(new Error('baam'))
FAQs
debug with levels
The npm package debug-level receives a total of 2,178 weekly downloads. As such, debug-level popularity was classified as popular.
We found that debug-level demonstrated a healthy version release cadence and project activity because the last version was released less than a year ago. It has 0 open source maintainers collaborating on the project.
Did you know?

Socket for GitHub automatically highlights issues in each pull request and monitors the health of all your open source dependencies. Discover the contents of your packages and block harmful activity before you install or update your dependencies.

Security News
GitHub removed 27 malicious pull requests attempting to inject harmful code across multiple open source repositories, in another round of low-effort attacks.

Security News
RubyGems.org has added a new "maintainer" role that allows for publishing new versions of gems. This new permission type is aimed at improving security for gem owners and the service overall.

Security News
Node.js will be enforcing stricter semver-major PR policies a month before major releases to enhance stability and ensure reliable release candidates.