Security News
/Research
Wallet-Draining npm Package Impersonates Nodemailer to Hijack Crypto Transactions
Malicious npm package impersonates Nodemailer and drains wallets by hijacking crypto transactions across multiple blockchains.
diat-stackvis-simplified
Advanced tools
Stackvis is a command line tool and JavaScript library for visualizing call stacks. For an example, see http://us-east.manta.joyent.com/dap/public/stackvis/example.htm. This approach (and the code for the SVG-based flamegraph) is based heavily on Brendan Gregg's FlameGraph tools.
Profile a program for 30 seconds:
# dtrace -n 'profile-97/pid == $YOURPID/{ @[jstack(80, 8192)] = count(); }' -c "sleep 30" > dtrace.out
then translate the DTrace output into a flame graph:
# stackvis < dtrace.out > flamegraph.htm
Or, create the flame graph and share it on Joyent's Manta service:
# stackvis < dtrace.out | stackvis share
https://us-east.manta.joyent.com/dap/public/stackvis/298c9ae2-aec8-4993-8bc9-d621dcdbeb71/index.htm
The default mode assumes input from a DTrace invocation like the above, and produces a D3-based visualization in a self-contained HTML file. You can explicitly specify input formats:
as well as output formats:
For example, to read "collapsed" output and produce a SVG flamegraph, use:
# stackvis collapsed flamegraph-svg < collapsed.out > flamegraph.svg
This module also provides the "stackcollapse" and "flamegraph" tools, which are essentially direct ports of the original FlameGraph tools. You can use them by first collecting data as above, then collapse common stacks:
# stackcollapse < dtrace.out > collapsed.out
then create a flame graph:
# flamegraph < collapsed.out > graph.svg
This approach is a little more verbose, but lets you filter out particular function names by grepping through the collapsed file.
The command-line tools are thin wrappers around the API, which is built upon a simple internal representation of stack traces and a bunch of Readers (lib/input-*.json) and Writers (lib/output-*.json) for various intermediate formats:
Client code shouldn't load these directly. Instead, require 'stackvis' and use lookupReader and lookupWriter:
var mod_stackvis = require('stackvis');
var dtrace_reader = mod_stackvis.readerLookup('dtrace');
var collapsed_writer = mod_stackvis.writerLookup('collapsed');
The main operation is translating from one representation to another (e.g., DTrace output to a flame graph) using pipeStacks() (which requires a Bunyan logger):
var mod_bunyan = require('bunyan');
var log = new mod_bunyan({ 'name': 'mytool', 'stream': process.stderr });
mod_stackvis.pipeStacks(log, process.stdin, dtrace_reader, collapsed_writer,
    process.stdout, function () { console.error('translation finished'); });
This example instantiates a new dtrace_reader to read DTrace output from process.stdin and then emits the result in collapsed form to process.stdout through the collapsed_writer.
It's easy to add new readers (for new input sources) and writers (for new types of visualizations). See lib/stackvis.js for an overview of how these interfaces work.
FAQs
stack visualization tools
We found that diat-stackvis-simplified demonstrated a not healthy version release cadence and project activity because the last version was released a year ago. It has 1 open source maintainer collaborating on the project.
Did you know?

Socket for GitHub automatically highlights issues in each pull request and monitors the health of all your open source dependencies. Discover the contents of your packages and block harmful activity before you install or update your dependencies.

Security News
/Research
Malicious npm package impersonates Nodemailer and drains wallets by hijacking crypto transactions across multiple blockchains.

Security News
This episode explores the hard problem of reachability analysis, from static analysis limits to handling dynamic languages and massive dependency trees.

Security News
/Research
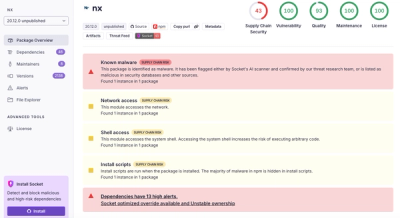
Malicious Nx npm versions stole secrets and wallet info using AI CLI tools; Socket’s AI scanner detected the supply chain attack and flagged the malware.