Security News
JSR Working Group Kicks Off with Ambitious Roadmap and Plans for Open Governance
At its inaugural meeting, the JSR Working Group outlined plans for an open governance model and a roadmap to enhance JavaScript package management.
Apache ECharts is a powerful, interactive charting and data visualization library for browser
ECharts is a powerful, interactive charting and visualization library for browser environments. It provides a wide range of chart types and is highly customizable, making it suitable for complex data visualization needs.
Line Chart
This code initializes a basic line chart with ECharts. It sets up the x-axis with categories representing days of the week and the y-axis with numerical values. The series data represents the values for each day.
const echarts = require('echarts');
const chart = echarts.init(document.getElementById('main'));
const option = {
xAxis: {
type: 'category',
data: ['Mon', 'Tue', 'Wed', 'Thu', 'Fri', 'Sat', 'Sun']
},
yAxis: {
type: 'value'
},
series: [{
data: [150, 230, 224, 218, 135, 147, 260],
type: 'line'
}]
};
chart.setOption(option);Bar Chart
This code initializes a basic bar chart with ECharts. Similar to the line chart, it sets up the x-axis with categories and the y-axis with numerical values. The series data represents the bar heights for each category.
const echarts = require('echarts');
const chart = echarts.init(document.getElementById('main'));
const option = {
  xAxis: {
    type: 'category',
    data: ['Mon', 'Tue', 'Wed', 'Thu', 'Fri', 'Sat', 'Sun']
  },
  yAxis: {
    type: 'value'
  },
  series: [{
    data: [120, 200, 150, 80, 70, 110, 130],
    type: 'bar'
  }]
};
chart.setOption(option);
Pie Chart
This code initializes a basic pie chart with ECharts. The series data represents different categories and their corresponding values, which are displayed as slices of the pie.
const echarts = require('echarts');
const chart = echarts.init(document.getElementById('main'));
const option = {
  series: [{
    type: 'pie',
    data: [
      { value: 1048, name: 'Search Engine' },
      { value: 735, name: 'Direct' },
      { value: 580, name: 'Email' },
      { value: 484, name: 'Union Ads' },
      { value: 300, name: 'Video Ads' }
    ]
  }]
};
chart.setOption(option);Chart.js is a simple yet flexible JavaScript charting library for designers & developers. It offers a variety of chart types and is known for its ease of use and integration. Compared to ECharts, Chart.js is more lightweight but may lack some of the advanced features and customizability.
Highcharts is a charting library written in pure JavaScript, offering an easy way of adding interactive charts to web sites or web applications. Highcharts is known for its extensive range of chart types and high level of customization. It is comparable to ECharts in terms of functionality but is a commercial product with licensing fees for certain uses.
D3.js is a JavaScript library for producing dynamic, interactive data visualizations in web browsers. It uses SVG, HTML, and CSS. D3 is highly flexible and powerful, allowing for complex and custom visualizations. However, it has a steeper learning curve compared to ECharts.

Apache ECharts is a free, powerful charting and visualization library offering easy ways to add intuitive, interactive, and highly customizable charts to your commercial products. It is written in pure JavaScript and based on zrender, which is a whole new lightweight canvas library.
You may choose one of the following methods:
npm install echarts --saveBuild echarts source code:
Execute the instructions in the root directory of the echarts: (Node.js is required)
# Install the dependencies from NPM:
npm install

# Rebuild source code immediately in watch mode when changing the source code.
# It opens the `./test` directory, and you may open `-cases.html` to get the list
# of all test cases.
# If you wish to create a test case, run `npm run mktest:help` to learn more.
npm run dev

# Check the correctness of TypeScript code.
npm run checktype

# If intending to build and get all types of the "production" files:
npm run release
Then the "production" files are generated in the dist directory.
Please refer to the contributing document if you wish to debug locally or make pull requests.
https://github.com/ecomfe/awesome-echarts
ECharts GL An extension pack of ECharts, which provides 3D plots, globe visualization, and WebGL acceleration.
Extension for Baidu Map 百度地图扩展 An extension provides a wrapper of Baidu Map Service SDK.
vue-echarts ECharts component for Vue.js
echarts-stat Statistics tool for ECharts
ECharts is available under the Apache License V2.
Please refer to Apache Code of Conduct.
Deqing Li, Honghui Mei, Yi Shen, Shuang Su, Wenli Zhang, Junting Wang, Ming Zu, Wei Chen. ECharts: A Declarative Framework for Rapid Construction of Web-based Visualization. Visual Informatics, 2018.
FAQs
Apache ECharts is a powerful, interactive charting and data visualization library for browser
The npm package echarts receives a total of 762,390 weekly downloads. As such, echarts popularity was classified as popular.
We found that echarts demonstrated a healthy version release cadence and project activity because the last version was released less than a year ago. It has 0 open source maintainers collaborating on the project.
Did you know?

Socket for GitHub automatically highlights issues in each pull request and monitors the health of all your open source dependencies. Discover the contents of your packages and block harmful activity before you install or update your dependencies.

Security News
At its inaugural meeting, the JSR Working Group outlined plans for an open governance model and a roadmap to enhance JavaScript package management.

Security News
Research
An advanced npm supply chain attack is leveraging Ethereum smart contracts for decentralized, persistent malware control, evading traditional defenses.

Security News
Research
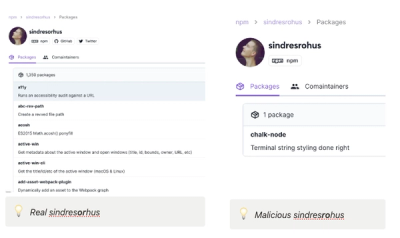
Attackers are impersonating Sindre Sorhus on npm with a fake 'chalk-node' package containing a malicious backdoor to compromise developers' projects.