ez-chart
生成图表配置的工具类,现有的图表库中会有大量的重复配置,而且配置分散不好维护,在同一个项目中图表的样式基本是统一的,
个别图形可能会有独特的样式,ez-chart就是为了解决这个问题出现的。通过一份配置参数生成echarts图表渲染所需要的option参数
使用vue框架的请结合ez-vue-chart使用会更加便捷
安装
npm install 'ez-chart'
yarn add 'ez-chart'
使用
import EzChart from 'ez-chart'
import echarts from 'echarts'
const ezChart = new EzChart();
const data = [
    {
      label: '数据1',
      val: 111,
      val2: 31,
    },
    {
      label: '数据2',
      val: 312,
      val2: 142,
    },
    {
      label: '数据3',
      val: 333,
      val2: 112,
    }
];
const type = 'bar';
const keyMap = ['label', 'val', 'val2'];
const option = ezChart.getOption({data, type, keyMap})
const instance = echarts.init({})
instance.setOption(option);
示例地址
效果展示
EzChart
简介
EzChart.extend(options)
扩展ezChart的基础配置
| options | 挂载到原型上的参数EzChart.options | object | -- | -- |
| options.customCharts | 自定义扩展图表类型 | object | -- | -- |
| options.echartsOption | 设置到全局的基础图表配置,会合并并覆盖基础配置 | object | -- | -- |
options.customCharts
可自定义处理要生成的option参数,自动绑定this指向到当前实例对象,可以直接调用内部的getOption方法
EzChart.extend({
  customCharts: {
    bottomLegend (options) {
      const option = this.getOption(Object.assign(options, {type: options.params.type}));
      Object.assign(option.legend, {
        bottom: 20,
        left: 'center',
        orient: 'horizontal'
      })
      return option
    }
  }
});
new EzChart(options)
实例化EzChart
| options | 当前实例的基础参数 | object | -- | -- |
| options.type | 当前实例的图表类型 | enmu | -- | -- |
| options.data | 数据集合 | array | -- | -- |
| options.keyMap | 键值集合 | array | -- | -- |
| options.params | 其他自定义参数 | Object | -- | -- |
| options.param.names | legend/serise.name | array | -- | -- |
| options.param.options | legend/serise.name | array | -- | -- |
特殊说明
type = bar/line
keyMap在条形图和折线图中 type = bar | line 第一位是label其余均为数据项
例如:
keyMap = ['date', 'max_value', 'min_value']则从数据list中获取到date 作为xAxis.data或yAxis.data ,
max_value和 min_value则作为option.series[0].data | option.series[1].data
数据项中的option.series[0].name从options.param.names[0]中获取
数据项中的option.legend.data从options.param.names]中获取
type = pie/funnel
keyMap 在饼图和漏斗图type = pie | funnel中赋值策略有不同 option.legend.data是keyMap的第一位
type = scatter
scatter keyMap中无label项
ezChart.getOption(options)
获取echarts图表渲染所需要的option参数
| options.type | 当前实例的图表类型 | enmu | -- | -- |
| options.data | 数据集合 | array | -- | -- |
| options.keyMap | 键值集合 | array | -- | -- |
| options.params | 其他自定义参数 | Object | -- | -- |
| options.param.names | legend/serise.name | array | -- | -- |
| options.param.options | legend/serise.name | array | -- | -- |
options.type
需要渲染的图表类型 同echarts.series.type目前支持
line bar pie scatter funnel 也可自定义扩展类型
EzChart.utils.checkOptions(options)
该方法用于检测必传参数
| options | 获取图表参数时传递的值 | object | -- | -- |
EzChart.utils.getParamsArray(keys, list)
该方法用于获取指定数组内的指定值
| keys | 需要获取的key值几何 | string/array | -- | -- |
| list | 待提取数据列表 | array<object>-- | -- | |
const keys = ['id','name']
const list = [{id:1,name:'xiaoming',desc:'ceshi'},{id:2,name:'xiaozhang',desc:'ceshi2'}]
EzChart.utils.getParamsArray(keys, list)
EzChart.utils.checkType(type)
判断用户传入的type是否支持
EzChart.utils.isDefType(type)
判断用户传入的type是否是默认的基础类型
EzChart.utils.isCustomType(type)
判断用户传入的type是否是自定义扩展的类型
外部依赖
externals: {
    echarts: 'echarts',
    vue: 'vue',
    lodash: 'lodash'
  }
示例及使用
结合ez-vue-chart使用
import Vue from 'vue'
import App from './App.vue'
import ezVuechart from 'ez-vue-chart'
import EzChart from 'ez-chart'
Vue.config.productionTip = false
Vue.use(ezVuechart);
EzChart.extend({
customCharts: {
bottomLegind (options) {
const option = this.getOption(Object.assign(options, {type: options.params.type}));
Object.assign(option.legend, {
bottom: 20,
left: 'center',
orient: 'horizontal'
})
return option
}
}
});
Vue.use(ezVueChart)
const test = new Vue({
el: '#app',
render: h => h(App)
})
<template>
<div id="app">
<ez-chart :data="data" :keyMap="['label', 'val', 'val2']" type="bar" @listener="listener" :register="['mouseover', 'click']"></ez-chart>
<ez-chart :data="data" :keyMap="['label', 'val']" type="pie"></ez-chart>
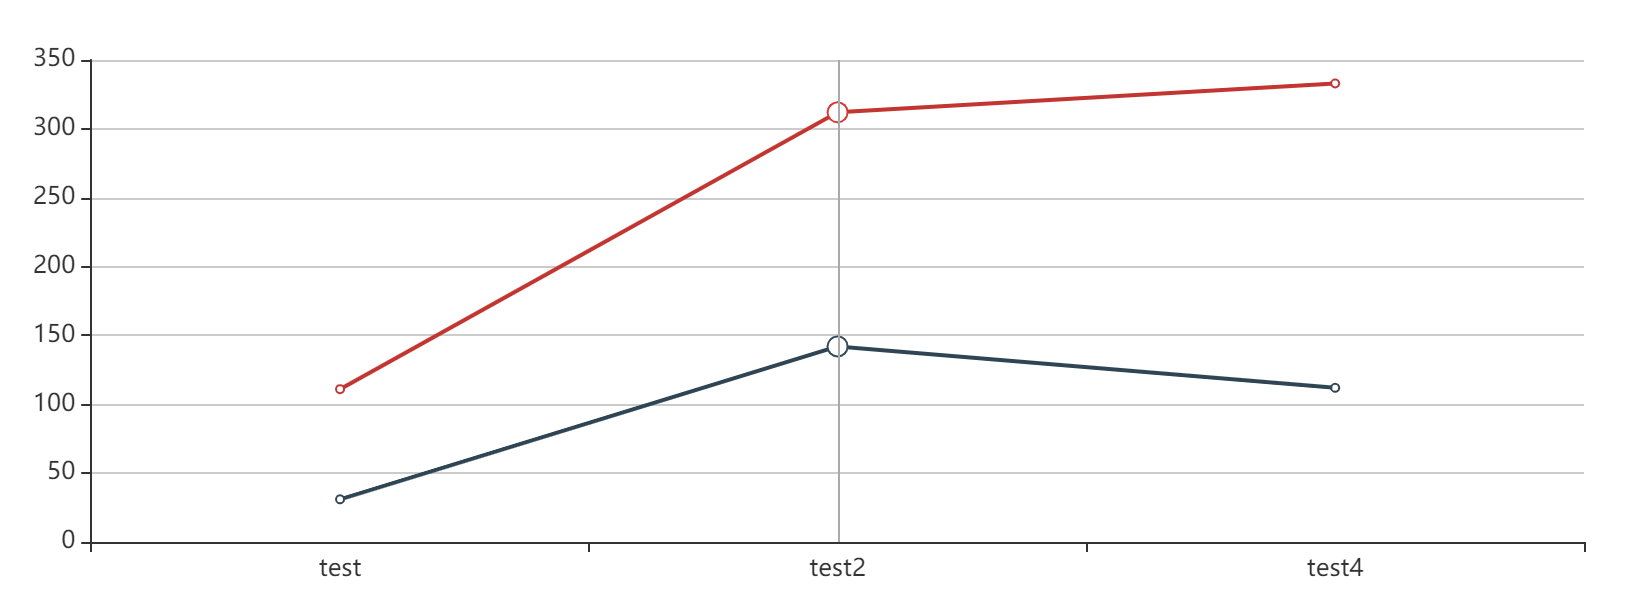
<ez-chart :data="data" :keyMap="['label', 'val', 'val2']" type="line"></ez-chart>
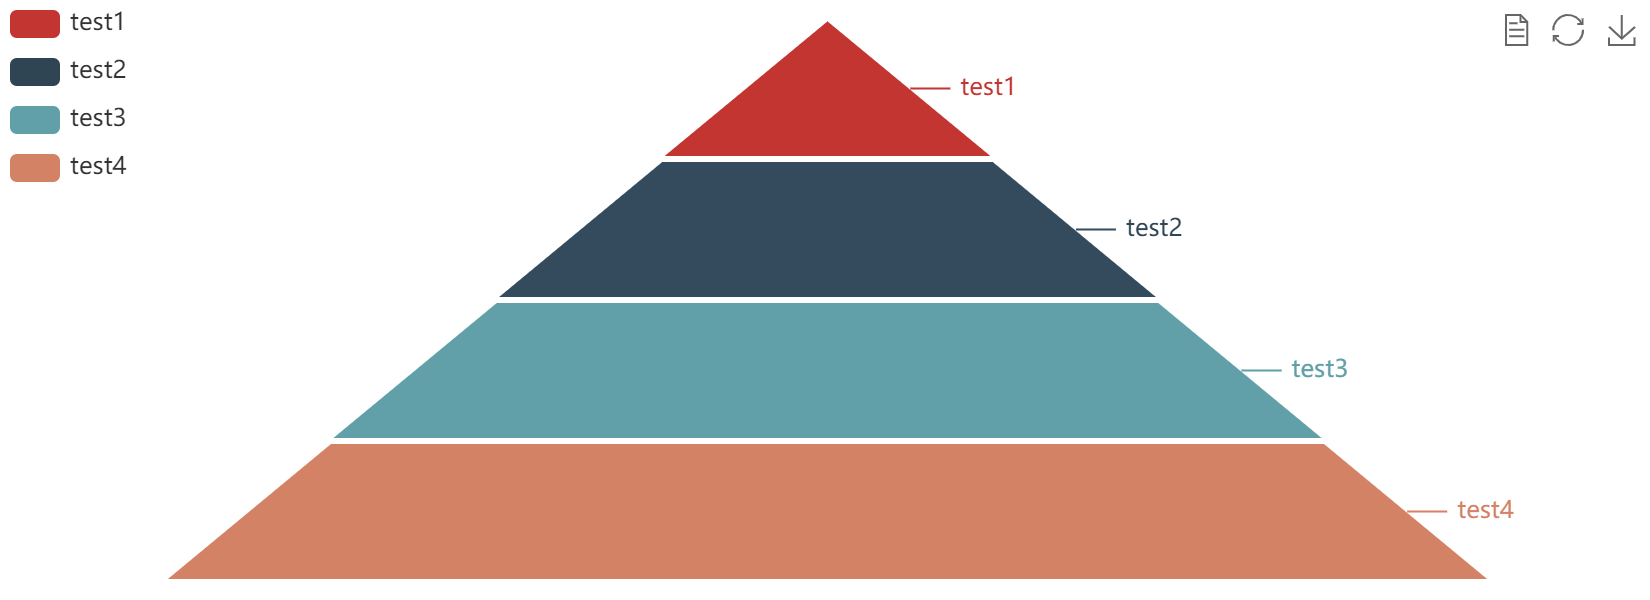
<ez-chart :data="funnelData" :keyMap="['label', 'val']" type="funnel"></ez-chart>
<ez-chart :data="data" :keyMap="['label', 'val']" log :params="{type: 'pie'}" type="bottomLegind"></ez-chart>
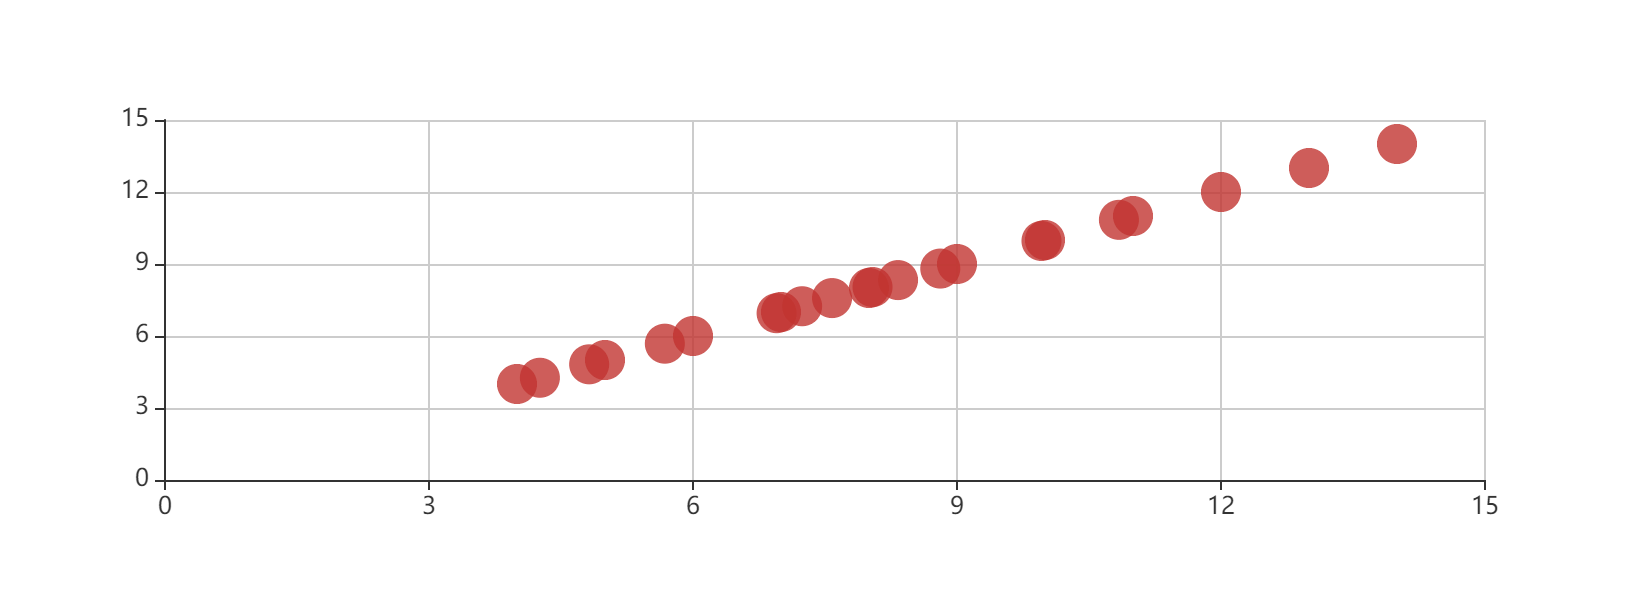
<ez-chart :data="data2" :keyMap="['val']" type="scatter"></ez-chart>
</div>
</template>
<script>
export default {
name: 'app',
data () {
return {
data: [
{
label: 'test',
val: 111,
val2: 31,
},
{
label: 'test2',
val: 312,
val2: 142,
},
{
label: 'test4',
val: 333,
val2: 112,
}
],
funnelData: [
{
label: 'test1',
val: 25,
},
{
label: 'test2',
val: 50,
},
{
label: 'test3',
val: 75,
},
{
label: 'test4',
val: 100,
}
],
data2: [
{
name: 'test',
val: [10.0, 8.04],
},
{
name: 'tes2t',
val: [8.0, 6.95],
},{
name: 'te32s3t',
val: [13.0, 7.58],
},{
name: 't1es3t',
val: [9.0, 8.81],
},{
name: 'te13s3t',
val: [11.0, 8.33],
},{
name: 't3es3t',
val: [14.0, 9.96],
},{
name: 't1es3t',
val: [6.0, 7.24],
},{
name: 't4es3t',
val: [4.0, 4.26],
},{
name: 'tes123t',
val: [12.0, 10.84],
},{
name: 'te2s3t',
val: [7.0, 4.82],
},{
name: 'tes113t',
val: [5.0, 5.68]
},
]
}
},
methods: {
listener (event, parmas, data) {
console.log(event, parmas, data)
}
}
}
</script>
默认样式展示
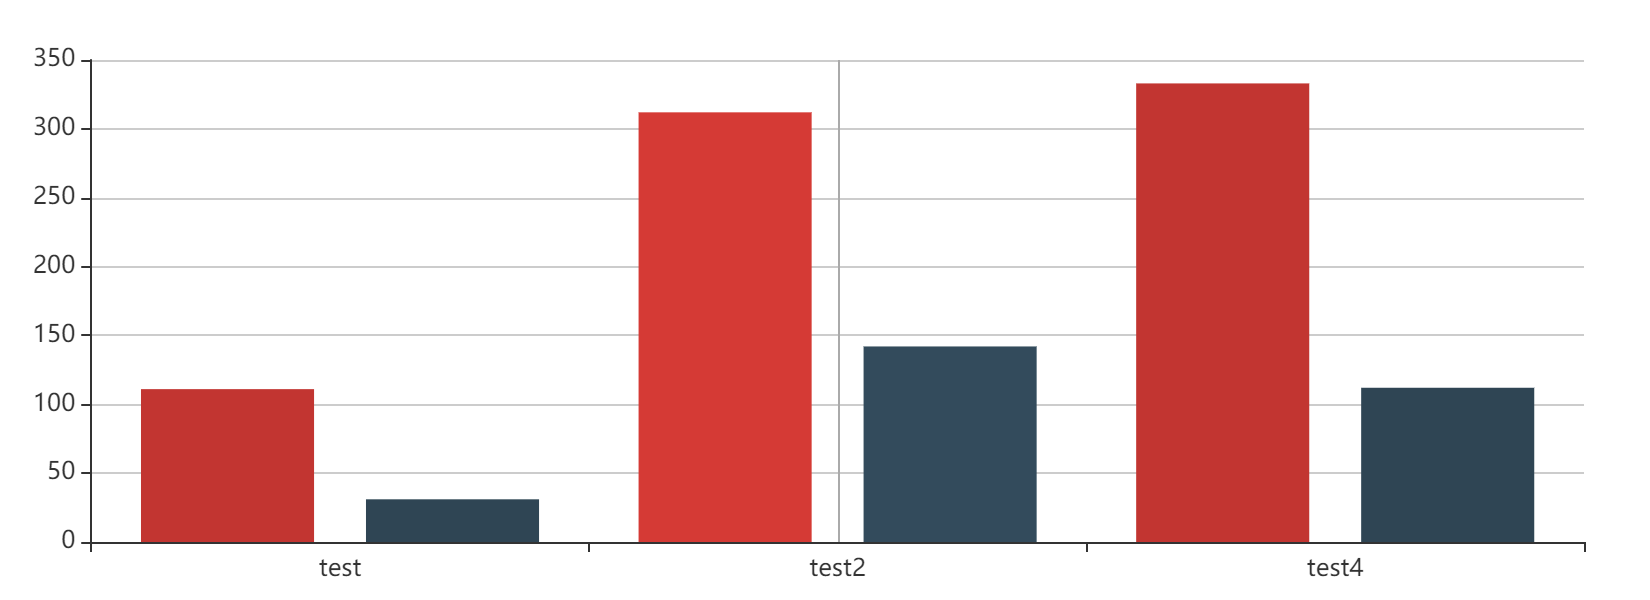
bar
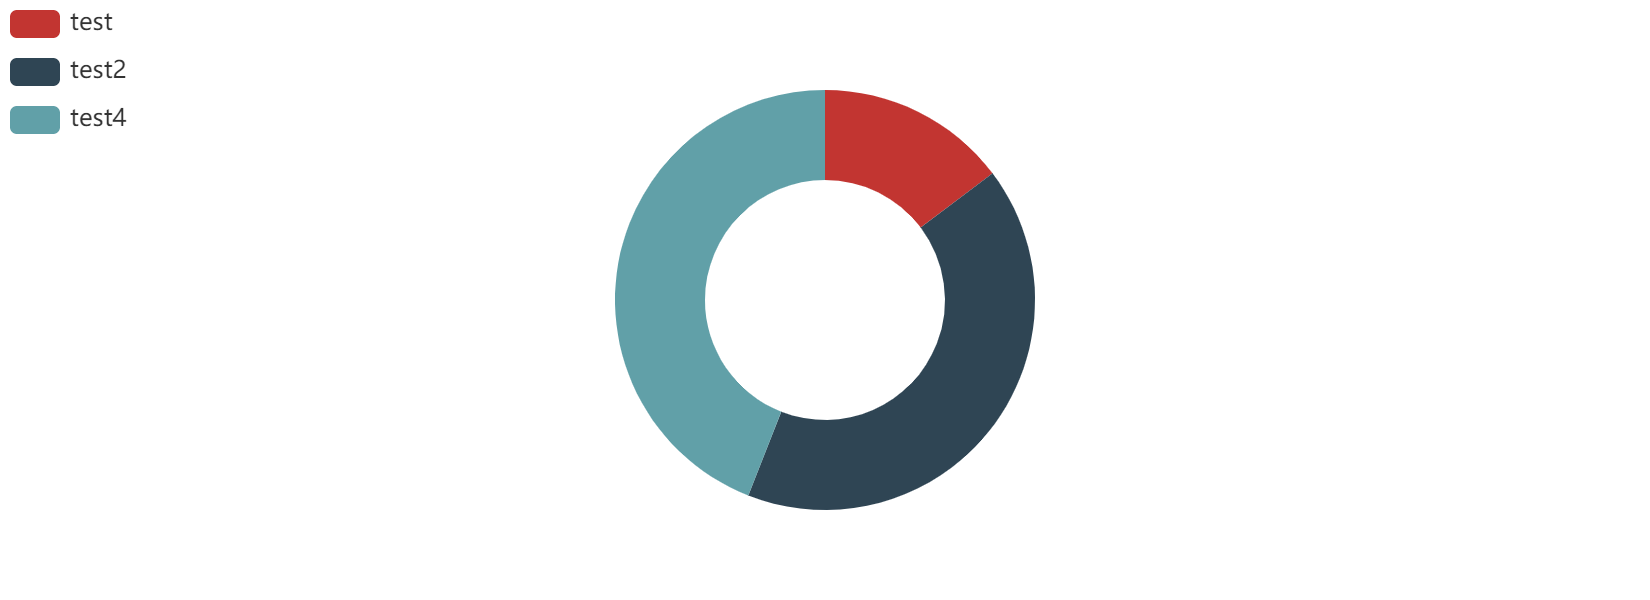
pie
line
funnel
scatter
bottomLegind