Research
Security News
Malicious npm Package Targets Solana Developers and Hijacks Funds
A malicious npm package targets Solana developers, rerouting funds in 2% of transactions to a hardcoded address.
google-charts
Advanced tools
ES6 Google Charts Module that allows asynchronous loading
yarn add -D google-charts
or
npm i -D google-charts
import {GoogleCharts} from 'google-charts';

//Load the charts library with a callback
GoogleCharts.load(drawChart);

function drawChart() {

    // Standard google charts functionality is available as GoogleCharts.api after load
    const data = GoogleCharts.api.visualization.arrayToDataTable([
        ['Chart thing', 'Chart amount'],
        ['Lorem ipsum', 60],
        ['Dolor sit', 22],
        ['Sit amet', 18]
    ]);
    const pie_1_chart = new GoogleCharts.api.visualization.PieChart(document.getElementById('chart1'));
    pie_1_chart.draw(data);
}
import {GoogleCharts} from 'google-charts';

//Load the 'corecharts'. You do not need to provide that as a type.
GoogleCharts.load(drawCharts);

/*
* Load a specific type(s) of chart(s). You can call this as many times as you need from anywhere in your app
* GoogleCharts is a singleton and will not allow the script to be loaded more than once
* The mapsApiKey is only required for certain GeoCharts
*/
GoogleCharts.load(drawGeoChart, {
    'packages': ['geochart'],
    'mapsApiKey': 'YOUR_API_KEY'
});

function drawCharts() {

    /* Pie chart 1 */
    const pie_1_data = GoogleCharts.api.visualization.arrayToDataTable([
        ['Chart thing', 'Chart amount'],
        ['Lorem ipsum', 60],
        ['Dolor sit', 22],
        ['Sit amet', 18]
    ]);
    const pie_1_options = {
        pieHole: 0.8,
        pieSliceTextStyle: {
            color: 'black',
        },
        slices: {
            0: {color: '#7ec252'},
            1: {color: '#a4ce57'},
            2: {color: '#cfe4ad'}
        },
        legend: {
            position: 'bottom',
            textStyle: {
                color: 'black',
                fontSize: 13,
                fontName: 'EncodeSans'
            }
        },
        title: 'Chart 1',
        titleTextStyle: {
            color: 'black',
            fontSize: 13,
            fontName: 'EncodeSans'
        },
        chartArea: {left: 0, top: 0, width: '100%', height: '80%'},
        pieSliceText: 'none'
    };
    const pie_1_chart = new GoogleCharts.api.visualization.PieChart(document.getElementById('chart1'));
    pie_1_chart.draw(pie_1_data, pie_1_options);

    /* Column chart 1 */
    const col_1_data = GoogleCharts.api.visualization.arrayToDataTable([
        ['Chart 1', 'Lorem ipsum', 'Dolor sit', 'Sit amet'],
        ['Chart 1', 22, 10, 68]
    ]);

    const col_1_options = {
        legend: {
            position: 'bottom',
            textStyle: {
                color: 'black',
                fontSize: 13,
                fontName: 'EncodeSans'
            }
        },
        bar: {groupWidth: '25%'},
        colors: ['#808e97', '#b9c3ca', '#dde4e8'],
        isStacked: true,
        chartArea: {left: 0, top: 0, width: '100%', height: '80%'},
        axisTitlesPosition: 'none',
        hAxis: {textPosition: 'none', gridlines: {color: 'transparent'}, baselineColor: 'transparent'},
        vAxis: {textPosition: 'none', gridlines: {color: 'transparent'}, baselineColor: 'transparent'},
    };

    const col_1_chart = new GoogleCharts.api.visualization.ColumnChart(document.getElementById('chart2'));
    col_1_chart.draw(col_1_data, col_1_options);
}

function drawGeoChart() {

    /* Geo Chart */
    const geo_1_data = GoogleCharts.api.visualization.arrayToDataTable([
        ['State', 'Spend'],
        ['ID', {v:120000, f: '$120,000'}],
        ['CO', {v:567135, f: '$567,135'}],
        ['FL', {v:220000, f: '$220,000'}],
        ['NY', {v:1120000, f: '$1,120,000'}],
        ['CA', {v:5120000, f: '$5,120,000'}],
        ['AK', {v:101000, f: '$101,000'}],
        ['AZ', {v:311030, f: '$311,030'}]
    ]);
    const geo_1_options = {
        region: 'US',
        resolution: 'provinces',
        is3D: true,
        legend: {
            numberFormat:'$###,###'
        }
    }
    const geo_1_chart = new GoogleCharts.api.visualization.GeoChart(document.getElementById('geo_1_chart'));
    geo_1_chart.draw(geo_1_data, geo_1_options);
}
FAQs
ES6 Google Charts Module that allows asynchronous loading
The npm package google-charts receives a total of 6,127 weekly downloads. As such, google-charts popularity was classified as popular.
We found that google-charts demonstrated a not healthy version release cadence and project activity because the last version was released a year ago. It has 1 open source maintainer collaborating on the project.
Did you know?

Socket for GitHub automatically highlights issues in each pull request and monitors the health of all your open source dependencies. Discover the contents of your packages and block harmful activity before you install or update your dependencies.

Research
Security News
A malicious npm package targets Solana developers, rerouting funds in 2% of transactions to a hardcoded address.

Security News
Research
Socket researchers have discovered malicious npm packages targeting crypto developers, stealing credentials and wallet data using spyware delivered through typosquats of popular cryptographic libraries.

Security News
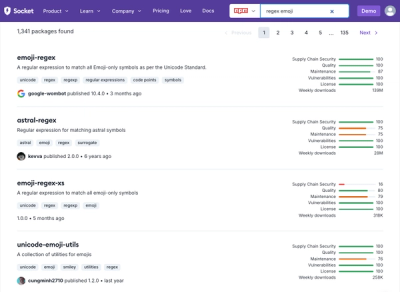
Socket's package search now displays weekly downloads for npm packages, helping developers quickly assess popularity and make more informed decisions.