Security News
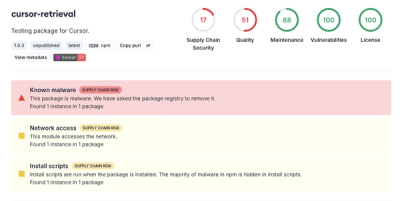
The Risks of Misguided Research in Supply Chain Security
Snyk's use of malicious npm packages for research raises ethical concerns, highlighting risks in public deployment, data exfiltration, and unauthorized testing.
hdr-histogram
Advanced tools
A port of HDR Histogram at http://hdrhistogram.github.io/HdrHistogram for use with node. All calls into the Java layer are asynchronous by default to improve performance.
##Build
Run npm install
####Solving known OSX java/jni build issues wrt the java node module
Ensure that JAVA_HOME is set to a JDK (not JRE)
e.g. export JAVA_HOME=/Library/Java/JavaVirtualMachines/jdk1.7.0_25.jdk/Contents/Home
and that the JDK is set up to support JNI (off by default on OSX),
i.e open $JAVA_HOME/../Info.plist and add JNI to the JVMCapabilities array.
see here for details
##Test
npm test##To install from npm registry
Run npm install hdr-histogram
##Example nodejs code //instantiate the hdr-histogram module with //- max value you expect to record //- min value you expect to record (must be greater than 1 so scale your recorded values appropriately) //- significant digits to record (precision) //- the log file to write to var hdr = require('hdr-histogram')(2000000, 1, 5, 'example.histogram.hlog');
//Record a latency value
hdr.recordValue(200); //this

//reset the recording process
hdr.reset();

All the above calls also return promises so that rather than fire-and-forget the caller can use the return value to determine when the call was completed
##To view the recorded results use the Visualizer to load the produced file. THis allows you to view the max-per-interval plot and the percentile plot without futher processing the log file.
##To generate and view percentile data Run the following script to process the histogram logs above and produce a percentile series log file
`./HistogramLogProcessor -i <log file outputted above> -o processedLogs`
A 'processedLogs.hgrm' file is generated. This can be ploted in excell or opened with the online Dynamic Histogram Plotter tool which dynamically show your percentiles
enjoy.
FAQs
A Port of Jil Tene's HdrHistogram for use in nodejs applications
The npm package hdr-histogram receives a total of 7 weekly downloads. As such, hdr-histogram popularity was classified as not popular.
We found that hdr-histogram demonstrated a not healthy version release cadence and project activity because the last version was released a year ago. It has 1 open source maintainer collaborating on the project.
Did you know?

Socket for GitHub automatically highlights issues in each pull request and monitors the health of all your open source dependencies. Discover the contents of your packages and block harmful activity before you install or update your dependencies.

Security News
Snyk's use of malicious npm packages for research raises ethical concerns, highlighting risks in public deployment, data exfiltration, and unauthorized testing.

Research
Security News
Socket researchers found several malicious npm packages typosquatting Chalk and Chokidar, targeting Node.js developers with kill switches and data theft.

Security News
pnpm 10 blocks lifecycle scripts by default to improve security, addressing supply chain attack risks but sparking debate over compatibility and workflow changes.