Security News
Crates.io Users Targeted by Phishing Emails
The Rust Security Response WG is warning of phishing emails from rustfoundation.dev targeting crates.io users.
By Sarah Gooding - Sep 12, 2025
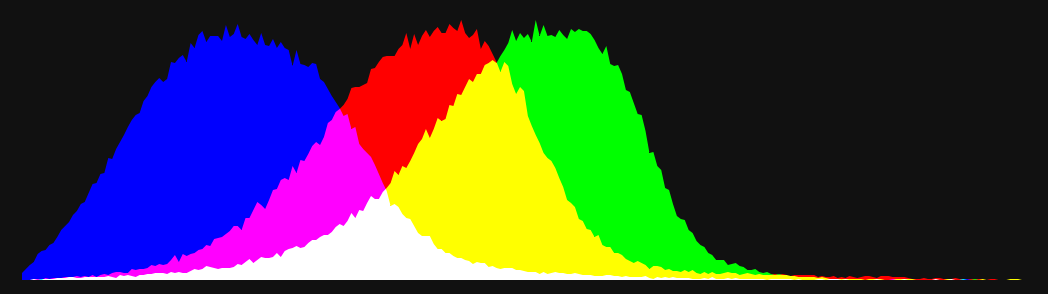
histogram-canvas
Advanced tools


yarn add histogram-canvas
or
npm i --save histogram-canvas
Import it:
const HistogramCanvas = require('histogram-canvas')
or include the standalone file, which is attached on each release or found in the dist folder when downloaded from the npm registry:
<script src="path/to/histogram-canvas.min.js"></script>
The constructor takes a Canvas and an optional options object:
let histogram = new HistogramCanvas(canvas, options)
update(data, dontClear)
data Object
Object with properties red, green, and blue, each arrays of numbers, representing the heights of the histogram bars. Arrays can be any length.
dontClear Boolean (false)
If true, the canvas will be cleared.
Can be passed in constructor options object and are available as properties on the instance.
Default values are in parentheses.
red Boolean (true)
Whether or not to draw red graph.
green Boolean (true)
Whether or not to draw green graph.
blue Boolean (true)
Whether or not to draw blue graph.
redColor String ('#FF0000')
Color for drawing red data
greenColor String ('#00FF00)
Color for drawing green data
blueColor String ('#0000FF')
Color for drawing blue data
compositeOperation String ('screen')
See options here
The following are for drawing the histogram at a specific location in the canvas. By default the histogram will fill the canvas.
x Number (0)
X coordinate of left side of histogram
y Number (canvas.height)
Y coordinate of bottom of histogram
width Number (canvas.width)
Width of histogram
height Number (canvas.height)
Height of histogram
MIT © Stephen Tuso
FAQs
Draw a photo histogram on a canvas
The npm package histogram-canvas receives a total of 0 weekly downloads. As such, histogram-canvas popularity was classified as not popular.
We found that histogram-canvas demonstrated a not healthy version release cadence and project activity because the last version was released a year ago. It has 1 open source maintainer collaborating on the project.
Did you know?

Socket for GitHub automatically highlights issues in each pull request and monitors the health of all your open source dependencies. Discover the contents of your packages and block harmful activity before you install or update your dependencies.
Security News
The Rust Security Response WG is warning of phishing emails from rustfoundation.dev targeting crates.io users.
Product
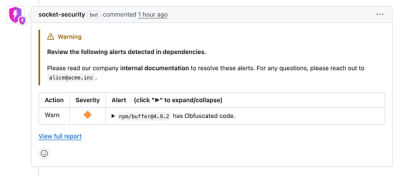
Socket now lets you customize pull request alert headers, helping security teams share clear guidance right in PRs to speed reviews and reduce back-and-forth.

Product
Socket's Rust support is moving to Beta: all users can scan Cargo projects and generate SBOMs, including Cargo.toml-only crates, with Rust-aware supply chain checks.