hyper-scatter


High-performance WebGL2 scatterplots for embedding exploration across Euclidean, Poincare, and spherical spaces.
Try the interactive demo and benchmark playground

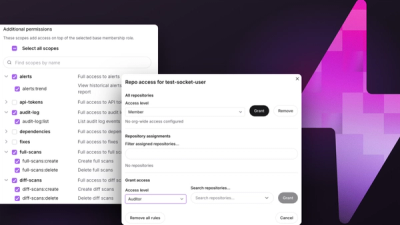
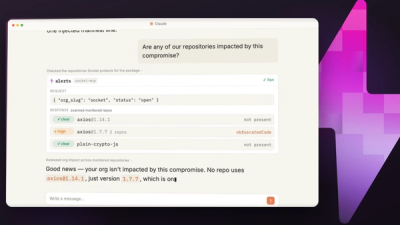
Poincaré pan and zoom with geometry-aware interaction
hyper-scatter is a low-level canvas renderer for large 2D and 3D embedding datasets.
- 2D geometries:
euclidean, poincare
- 3D geometries:
euclidean3d, sphere
- Built-in hit testing, lasso selection, hover, selection, and secondary highlight states
- Runtime styling updates without recreating the renderer
- Pure WebGL2 with no runtime dependencies
It is used inside HyperView, but the package is designed to be used directly in your own app.
Install
npm install hyper-scatter
Quickstart
Make sure the canvas has a real CSS size before initialization.
<canvas id="plot" style="width: 100%; height: 480px; display: block;"></canvas>
import {
createDatasetFromColumns,
createInteractionController,
createScatterPlot,
} from "hyper-scatter";
const canvas = document.querySelector("#plot");
if (!(canvas instanceof HTMLCanvasElement)) {
throw new Error("Missing canvas element");
}
const x = new Float32Array([0.15, -0.3, 0.4, -0.55, 0.18, -0.08]);
const y = new Float32Array([0.2, 0.1, -0.25, 0.42, 0.28, -0.4]);
const labels = new Uint16Array([0, 1, 1, 2, 0, 2]);
const rect = canvas.getBoundingClientRect();
const plot = createScatterPlot(canvas, {
geometry: "poincare",
width: Math.max(1, Math.floor(rect.width)),
height: Math.max(1, Math.floor(rect.height)),
devicePixelRatio: window.devicePixelRatio,
pointRadius: 3,
backgroundColor: "#0b1020",
colors: ["#a7f3d0", "#60a5fa", "#f59e0b"],
dataset: createDatasetFromColumns("poincare", x, y, labels),
});
plot.setInteractionStyle({
selectionColor: "#f59e0b",
highlightColor: "#94a3b8",
hoverColor: "#ffffff",
});
plot.render();
const controller = createInteractionController(canvas, plot, {
lassoPredicate: (event) => event.shiftKey,
onHover: (hit) => {
console.log("hovered point", hit?.index ?? null);
},
onLassoUpdate: (_dataPolygon, screenPolygon) => {
plot.setLassoPolygon(screenPolygon, {
strokeColor: "#4f46e5",
fillColor: "rgba(79, 70, 229, 0.15)",
});
plot.render();
},
onLassoComplete: async (result, _dataPolygon, screenPolygon) => {
plot.setLassoPolygon(screenPolygon);
if (result.kind === "indices" && result.indices) {
plot.setSelection(result.indices);
plot.setInactiveOpacity(result.indices.size > 0 ? 0.35 : 1);
plot.render();
return;
}
const count = await plot.countSelection(result, { yieldEveryMs: 0 });
console.log("lasso selected", count, "points");
plot.render();
},
});
window.addEventListener("resize", () => {
const next = canvas.getBoundingClientRect();
plot.resize(
Math.max(1, Math.floor(next.width)),
Math.max(1, Math.floor(next.height)),
);
plot.render();
});
The same factory works for 3D renderers. Use createDataset3D() or createDataset3DFromColumns() with geometry: "euclidean3d" or geometry: "sphere".
Geometry Modes
euclidean | 2D | createDataset, createDatasetFromColumns | Standard planar scatterplot |
poincare | 2D | createDataset, createDatasetFromColumns | Hyperbolic embeddings in the Poincaré disk |
euclidean3d | 3D | createDataset3D, createDataset3DFromColumns | Orthographic orbit camera |
sphere | 3D | createDataset3D, createDataset3DFromColumns | Unit-sphere layouts with optional guide rendering |
See docs/geometries.md for view-state and styling details.
Emphasis and Display State
You can update renderer state without rebuilding the dataset:
plot.setSelection(new Set([1, 4]));
plot.setHighlight(new Set([0, 2, 3]));
plot.setInactiveOpacity(0.3);
plot.setPalette(["#d1fae5", "#93c5fd", "#fdba74"]);
plot.setCategoryVisibility([1, 1, 0]);
plot.render();
Important details:
setSelection() is the primary emphasis channel.setHighlight() is a secondary emphasis channel for neighbors, search hits, or related points.setInactiveOpacity() dims non-emphasized visible points while keeping the emphasized states readable.
Lasso and Interaction
createInteractionController() is the packaged input controller for 2D renderers.
- Default lasso gesture:
Shift + Meta or Ctrl drag
- Override
lassoPredicate if you want Shift-drag or another gesture
- Use
onLassoUpdate() to draw a renderer-owned polygon overlay with setLassoPolygon()
- Use
onLassoComplete() to apply setSelection() or to inspect the returned SelectionResult
2D selections may be returned as explicit indices or as a geometry-backed predicate. If you only need an exact count, call countSelection() instead of scanning the full dataset yourself.
3D renderers expose the same selection and hover methods, but input handling is currently host-driven rather than shipped through createInteractionController().
See docs/interaction-and-lasso.md for the full interaction model.
Guides
Benchmarks
Measured through the browser harness in headed mode on a 1125x400 canvas at 1x DPR.
| Euclidean | 20,000,000 | 59.9 |
| Poincaré | 20,000,000 | 59.9 |
Reproduce the stress run:
npm run bench -- --points=20000000
Useful commands:
npm run bench for the default WebGL benchmark sweepnpm run bench -- --geometries=euclidean,poincare,euclidean3d,sphere for all geometry modesnpm run bench:accuracy for the 2D reference-vs-candidate accuracy harness
Headed runs are the source of truth for performance numbers. Headless runs are fine for smoke checks, but not for serious benchmarking.
Status
How we built it
hyper-scatter started as the rendering core for HyperView, but it was built like a small visualization lab rather than a one-off widget.
1. Reference first
We wrote slower, readable reference renderers first and treated them as the source of truth for:
- projection and unprojection
- pan and zoom semantics
- hit testing
- lasso behavior
That gave us a stable semantic target before optimizing anything.
2. Harness before optimization
Once the reference path existed, we built browser-side accuracy and benchmark harnesses around it.
- accuracy checks compare the candidate renderer against the reference renderer
- benchmarks measure rendering, interaction, and selection behavior
- this keeps performance work from drifting into behavior regressions
The result is that the fast path is expected to match the slow path, not invent its own semantics.
3. Candidate renderer second
The WebGL2 candidate renderer came after that. The performance work is mostly about:
- pushing point rendering to the GPU
- keeping interaction smooth at high point counts
- preserving exact hit testing and lasso behavior where it matters
That same pattern is why the package now has first-class selection, highlight, inactive-opacity, and renderer-owned lasso support instead of forcing host apps to stack custom overlay behavior on top.
4. Productizing it
The latest pass was about turning it into something other teams could actually use.
- a single
createScatterPlot() entry point
- column-oriented dataset helpers
- better public docs and quickstart examples
- direct integration back into HyperView from the published npm package
5. Semantic labels, not word clouds
The package now exports semantic label helpers for cluster-style labels that can be laid out over the scatterplot. That is adjacent to word-cloud-style summarization, but it is not a full word cloud renderer or word cloud API.
License
MIT © Matin Mahmood (X: @MatinMnM)