

Security News
PyPI’s New Archival Feature Closes a Major Security Gap
PyPI now allows maintainers to archive projects, improving security and helping users make informed decisions about their dependencies.
By Sarah Gooding - Jan 30, 2025
maplibre-gl-interpolate-heatmap
Advanced tools


![]()


InterpolateHeatmapLayer is a minimalist JavaScript library for rendering temperature maps (or interpolate heatmaps) with Mapbox GL JS. This library was greatly inspired by the temperature-map-gl library, and depends on Earcut.
Currently, Mapbox provides a heatmap layer that represent the density of points in an area, like on this picture:

This library aims at providing a heatmap that can define a color to any location by making an average of the values of the surroundings points, like on this picture:

Except a JavaScript pre-processing step, all computation is made with WebGL shaders.
A live demo showing the global temperature is available here, described here.
Browser:
Import the library before the script using it:
<body>
<div id="map"></div>
<script src="maplibre-gl-interpolate-heatmap.cjs.js"></script>
<script src="map.js"></script>
</body>
Create the Mapbox map and add the layer created by interpolateHeatmapLayer.create():
// map.js

const map = new mapboxgl.Map({
  container: 'map',
  style: 'mapbox://styles/mapbox/light-v10',
});

map.on('load', () => {
  const layer = new MapboxInterpolateHeatmapLayer({
    // parameters here
  });
  map.addLayer(layer);
});
NPM:
npm install maplibre-gl-interpolate-heatmap
import { MapboxInterpolateHeatmapLayer } from 'maplibre-gl-interpolate-heatmap';

const map = new mapboxgl.Map({
  container: 'map',
  style: 'mapbox://styles/mapbox/light-v10',
});

map.on('load', () => {
  const layer = new MapboxInterpolateHeatmapLayer({
    // parameters here
  });
  map.addLayer(layer);
});
The new MapboxInterpolateHeatmapLayer() function has the following parameters:
data: An array of points, each point being an object containing a latitude lat, a longitude lon, and a value val. Example:
data = [
  {
    lat: 62.470663,
    lon: 6.176846,
    val: 16,
  },
  {
    lat: 48.094903,
    lon: -1.371596,
    val: 20,
  },
];
Since Mapbox uses the Web Mercator projection that projects the poles at infinity, remember to define the latitude within -85° and 85°. Default value: [].
id: unique Mapbox layer name. Default value: ''.
opacity: a number between 0 and 1 describing the transparency of the color. Default value: 0.5.
minValue: define the value corresponding to the blue color. When it's not defined, the lowest value of points is represented by the blue color. If some value of points is lower than minValue, minValue takes this value. Default value: Infinity.
maxValue same, but for the red color. Default value: -Infinity.
framebufferFactor: number between 0 and 1. In short, if the framebuffer factor is around 0, the computation will be faster but less accurate. Take a look at the technical explanation part if you want to know what exactly this parameter is. Default value: 0.3.
p: a factor affecting the computation of the color. A high value makes the color uniform around each point. Once again, take a look at the technical explanation part if you want to know more. Default value: 3.
aoi: area of interest, the layer will only be displayed inside that area. It's a list of coordinates with the same format as points (without the val attribute). If the list is empty, the entire map is the region of interest. Default value: [].
valueToColor: GLSL function (passed as a string) that map a value to the heatmap color. By default, a low value is colored blue, a medium green and a high red. This parameter allows you to change this behavior. The function must be named valueToColor with a float parameter (which will take values between 0 and 1), and must return a vec3 (with each component between 0 and 1). Default value:
vec3 valueToColor(float value) {
  return vec3(max((value-0.5)*2.0, 0.0), 1.0 - 2.0*abs(value - 0.5), max((0.5-value)*2.0, 0.0));
}
valueToColor4: Same as valueToColor, but with alpha channel support. The function name and signature must be defined as:
vec4 valueToColor4(float value, float defaultOpacity)
Default value:
vec4 valueToColor4(float value, float defaultOpacity) {
    return vec4(valueToColor(value), defaultOpacity);
}
The color is computed using the Inverse Distance Weighting (IDW) algorithm:
Let:
be N known data points. We want to find a continuous and once differentiable function:
such as:
The basic form of the IDW is:
where
In WebGL:
The size of the computation textures is the size of the rendering texture multiplied by the framebufferFactor. This factor can be below 0.5 without any real visual consequences. If the user has defined a region of interest and uses a framebufferFactor < 1, visual artifacts appear at the edge of the heatmap. To prevent this, the rendering texture takes the whole screen size if framebufferFactor < 1.
dev (git checkout -b feat/new-feature)git commit -Sam 'feat: add feature')git push origin feat/new-feature)Note:
MIT © GeoSpoc Dev Team & Vinayak Kulkarni

FAQs
Mapbox layer for average/interpolation heatmaps
The npm package maplibre-gl-interpolate-heatmap receives a total of 8 weekly downloads. As such, maplibre-gl-interpolate-heatmap popularity was classified as not popular.
We found that maplibre-gl-interpolate-heatmap demonstrated a not healthy version release cadence and project activity because the last version was released a year ago. It has 1 open source maintainer collaborating on the project.
Did you know?

Socket for GitHub automatically highlights issues in each pull request and monitors the health of all your open source dependencies. Discover the contents of your packages and block harmful activity before you install or update your dependencies.
Security News
PyPI now allows maintainers to archive projects, improving security and helping users make informed decisions about their dependencies.

Research
Security News
Malicious npm package postcss-optimizer delivers BeaverTail malware, targeting developer systems; similarities to past campaigns suggest a North Korean connection.
Security News
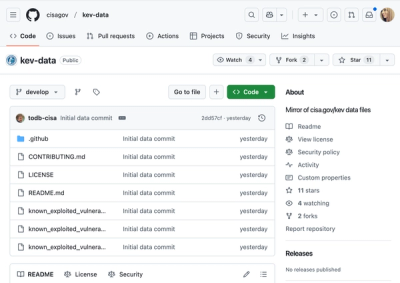
CISA's KEV data is now on GitHub, offering easier access, API integration, commit history tracking, and automated updates for security teams and researchers.