What is mermaid?
Mermaid is a JavaScript-based diagramming and charting tool that renders Markdown-inspired text definitions to create and dynamically modify diagrams. It is particularly useful for creating flowcharts, sequence diagrams, class diagrams, state diagrams, Gantt charts, and more.
What are mermaid's main functionalities?
Flowcharts
Mermaid allows you to create flowcharts using a simple syntax. The above code creates a flowchart with decision points and different paths.
```mermaid
flowchart TD
A[Start] --> B{Is it?}
B -->|Yes| C[OK]
B -->|No| D[Not OK]
C --> E[End]
D --> E[End]
```
Sequence Diagrams
Sequence diagrams can be created to represent interactions between different participants over time. The code sample shows a simple interaction between Alice and Bob.
```mermaid
sequenceDiagram
    participant Alice
    participant Bob
    Alice->>Bob: Hello Bob, how are you?
    Bob-->>Alice: I am good thanks!
```
Gantt Charts
Mermaid supports Gantt charts for project planning and scheduling. The code sample demonstrates how to define tasks and their durations.
```mermaid
gantt
    title A Gantt Diagram
    dateFormat  YYYY-MM-DD
    section Section
    A task           :a1, 2023-01-01, 30d
    Another task     :after a1  , 20d
    section Another
    Task in sec      :2023-01-12  , 12d
    another task     : 24d
```
Class Diagrams
Class diagrams can be used to represent the structure of a system by showing its classes, attributes, and methods. The code sample shows a simple class diagram with inheritance.
```mermaid
classDiagram
    class Animal
    Animal : +String name
    Animal : +int age
    Animal : +void eat()
    Animal : +void sleep()
    class Dog
    Dog : +String breed
    Dog : +void bark()
    Animal <|-- Dog
```
State Diagrams
State diagrams represent the states of an object and transitions between those states. The code sample shows a simple state diagram with different states and transitions.
```mermaid
stateDiagram-v2
    [*] --> Still
    Still --> [*]
    Still --> Moving
    Moving --> Still
    Moving --> Crash
    Crash --> [*]
```
Other packages similar to mermaid
flowchart.js
Flowchart.js is a simple library to create flowcharts using JavaScript. It is less feature-rich compared to Mermaid but is easier to use for basic flowchart needs.
js-sequence-diagrams
js-sequence-diagrams is a library specifically for creating sequence diagrams. It offers a more focused approach to sequence diagrams but lacks the versatility of Mermaid.
chart.js
Chart.js is a popular library for creating various types of charts and graphs. While it does not support diagrams like flowcharts or sequence diagrams, it excels in creating data-driven charts.
d3
D3.js is a powerful library for creating complex and interactive data visualizations. It offers more flexibility and control compared to Mermaid but requires a steeper learning curve.
mermaid 
Generation of diagrams and flowcharts from text in a similar manner as markdown.
Ever wanted to simplify documentation and avoid heavy tools like Visio when explaining your code?
This is why mermaid was born, a simple markdown-like script language for generating charts from text via javascript.
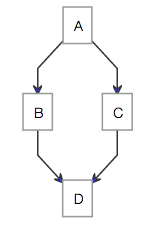
The code below would render the following image
graph TD;
    A-->B;
    A-->C;
    B-->D;
    C-->D;
would render this lovely chart:
A simple page with a live example can be seen here. You can also look at mermaid in action using jsbin.
#Installation
Either use the bower package manager as per below:
bower install mermaid --save-dev
Or download javascript files:
This file bundles mermaid with d3 and dagre-d3.
With this file you will need to include d3 and dagre-d3 yourself.
Usage
Include mermaid on your web page:
<script src="mermaid.full.min.js"></script>
Further down on your page mermaid will look for tags with class="mermaid". From these tags mermaid will try to
read the chart definiton which will be replaced with the svg chart.
A chart defined like this:
<div class="mermaid">
    CHART DEFINITION GOES HERE
</div>
Would end up like this:
<div class="mermaid" id="mermaidChart0">
    <svg>
        Chart ends up here
    </svg>
</div>
An id is also added to mermaid tags without id.
A graph example
graph LR;
    A[Hard edge]-->|Link text|B(Round edge);
    B-->C{Decision};
    C-->|One|D[Result one];
    C-->|Two|E[Result two];

#Syntax
Graph
This statement declares a new graph and the direction of the graph layout.
graph TD
This declares a graph oriented from top to bottom.

graph LR
This declares a graph oriented from left to right.
Possible directions are:
- TB - top bottom
- BT - bottom top
- RL - right left
- LR - left right
- TD - same as TB

Nodes
A node (default)
id1;

Note that the id is what is displayed in the box.
A node with text
It is also possible to set text in the box that differs from the id. If this is done several times, it is the last text
found for the node that will be used. Also if you define edges for the node later on, you can omit text definitions. The
one previously defined will be used when rendering the box.
id1[This is the text in the box];

A node with round edges
id1(This is the text in the box);

A node in the form of a circle
id1((This is the text in the box));

A node in an asymetric shape
id1>This is the text in the box];

A node (rhombus)
id1{This is the text in the box};

Styling a node
It is possible to apply specific styles such as a thicker border or a different background color to a node.
graph LR;
    id1(Start)-->id2(Stop);
    style id1 fill:#f9f,stroke:#333,stroke-width:4px;
    style id2 fill:#ccf,stroke:#f66,stroke-width:2px,stroke-dasharray: 5, 5;

Classes
More convenient then defining the style everytime is to define a class of styles and attach this class to the nodes that
should have a different look.
a class definition looks like the example below:
classDef className fill:#f9f,stroke:#333,stroke-width:4px;
Attachment of a class to a node is done as per below:
class nodeId1 className;
It is also possible to attach a class to a list of nodes in one statement:
class nodeId1,nodeId2 className;
Default class
If a class is named default it will be assigned to all classes without specific class definitions.
classDef default fill:#f9f,stroke:#333,stroke-width:4px;
Links between nodes
Nodes can be connected with links/edges. It is possible to have different types of links or attach a text string to a link.
A link with arrow head
A-->B;
An open link
A---B;

Text on links
A---|This is the text|B;

Styling links
It is possible to style links for instance a link that is going back in the flow. This is done by the linkStyle statement as in the example below:
linkStyle 3 stroke:#ff3,stroke-width:4px;
Interaction
It is possible to bind a click event to a node:
click nodeId callback
- nodeId is the id of the node
- callback is the name of a javascript function defined on the page displaying the graph, the function will be called with the nodeId as parameter.
Usage of the parser as a seperate module
Setup
var graph = require('./graphDb');
var flow = require('./parser/flow');
flow.parser.yy = graph;
Parsing
flow.parser.parse(text);
graph.getDirection();
graph.getVertices();
graph.getEdges();
Credits
Many thanks to the d3 and dagre-d3 projects for providing the graphical layout and drawing libraries!