Product
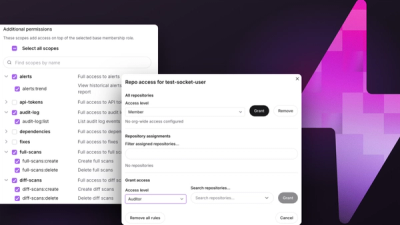
Introducing Repository Access Permissions and Custom Roles
Socket now supports Custom Roles and Repository Access Permissions so organizations can control who can access specific repositories and actions.
By Joe Werle - Jun 19, 2026
node-red-contrib-ui-timeline
Advanced tools
A Node-RED-Dashboard UI widget node that displays timeline. Google-like timeline chart based on Chart.js.
Either use the Editor - Menu - Manage Palette - Install option, or run the following command in your Node-RED user directory (typically ~/.node-red) after installing Node-RED-dashboard.
    npm i node-red-contrib-ui-timeline
    npm i https://github.com/PO-CES-EDGE/node-red-contrib-ui-timeline


This timeline node expects msg.payload to contain an array of array of timeline data, one object per row.
Each data row object should have the same set of values:
[
  [
    "Start Extruders",
    1619861576130,
    1619866976130
  ],
  [
    "Raise to starting speeds",
    1619866976130,
    1619868476130
  ],
  [
    "Raise to starting speeds",
    1619868476130,
    1619870276130
  ],

  [
    "Stop",
    1619900816130,
    1619902076130
  ]
]
(No output)
Input data into message payload must be an array of array of 3 items [[String, date timestamp, date timestamp], ....]
Example of JavaScript validation with Joi:
const dataSchema = Joi.array().items(stepSchema).required();
const stepSchema = Joi.array().length(3).items(Joi.string().required(), Joi.date().timestamp().required(), Joi.date().timestamp().required());
Configuration

The configuration is used to change how the timeline behaves. There are properties to control styling, fonts, the legend, etc.
Configuration key Description Display label Display label of each element Enable responsive Enable responsive design: Resizes the chart canvas when its container does. Text padding Label padding space Y-axis configuration Background colors Choose two colors for y-axis grid background color Repeat two colors Repeat two background colors on y-axis grid. Elements or steps background color configuration Palette 1 Choose palette 1 colors Palette 2 Choose palette 2 colors
FAQs
Timeline UI widget node for Node-RED Dashboard
We found that node-red-contrib-ui-timeline demonstrated a not healthy version release cadence and project activity because the last version was released a year ago. It has 1 open source maintainer collaborating on the project.
Did you know?

Socket for GitHub automatically highlights issues in each pull request and monitors the health of all your open source dependencies. Discover the contents of your packages and block harmful activity before you install or update your dependencies.
Product
Socket now supports Custom Roles and Repository Access Permissions so organizations can control who can access specific repositories and actions.
Product
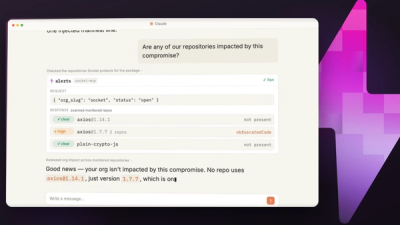
Socket MCP now lets AI assistants review org alerts, investigate threats using the Socket threat feed, and inspect package files in addition to dependency scoring.
Product
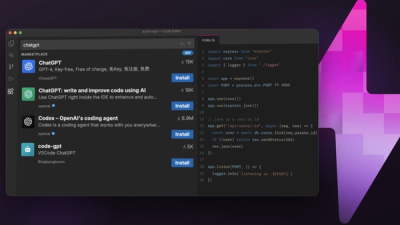
Socket Firewall blocks malicious VS Code and Open VSX extensions before install, protecting developers from compromised editor marketplaces.