Security News
Node.js EOL Versions CVE Dubbed the "Worst CVE of the Year" by Security Experts
Critics call the Node.js EOL CVE a misuse of the system, sparking debate over CVE standards and the growing noise in vulnerability databases.
phantomflow
Advanced tools
Unmaintained notice: As of December 22nd 2017 this project will no longer be maintained. What started out as a creative experiment four years ago became a significant tool in Huddle's Web development workflow, as well as the workflows of external Web engineers. But like PhantomCSS, its time to move on.
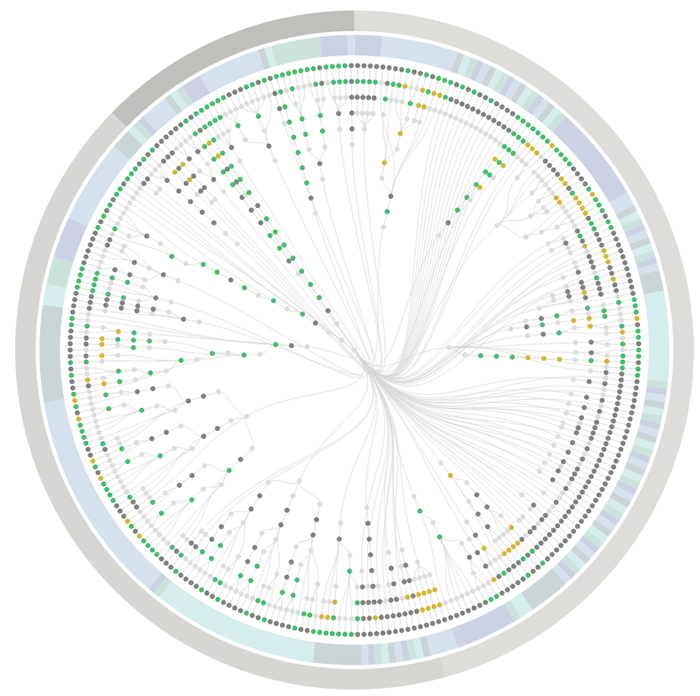
UI testing with decision trees. An experimental approach to UI testing, based on Decision Trees. A NodeJS wrapper for PhantomJS, CasperJS and PhantomCSS, PhantomFlow enables a fluent way of describing user flows in code whilst generating structured tree data for visualisation.

The above visualisation is a real-world example, showing the complexity of visual testing at Huddle.
$ git clone https://github.com/Huddle/PhantomFlow.git
$ cd PhantomFlow
$ npm install
npm install phantomflowPhantomFlow also comes as grunt plugin! grunt-phantomflow
node test/test.js - First run will create visual test baslines with PhantomCSSnode test/test.js - Second run will compare baseline visuals with the latest screenshots. This'll pass because there have been no changes.node test/test.js report - An optional step to load the Decision tree visualisation into your Web browsernode test/test.js dashboard - Run the tests in dashboard mode to see test progress (useful for many parallelised tests)
Mac OSX users should be aware that PhantomJS doesn't load the FontAwesome glyths used in the test suite, I don't understand why. I fixed this locally by downloading FontAwesome and double clicking on the .otf file to install the font.
There are two example test suites, these suites will be executed in parallel, the command line output is a bit muddled as a result.
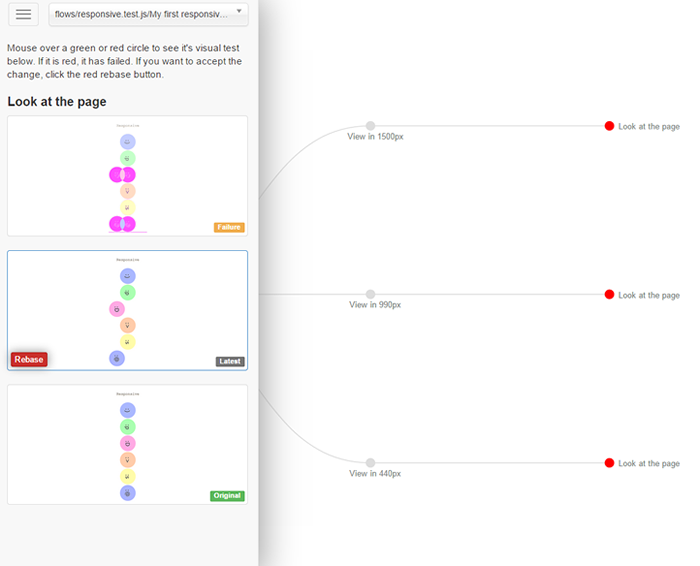
The D3.js visualisation opens with a combined view which merges the test decision trees. Click on a branch label or use the dropdown to show a specific test. Hover over the nodes to see the PhantomCSS screenshots. If there is a visual test failure the node will glow red, hover and click the node to show the original, latest and generated diff screenshots.
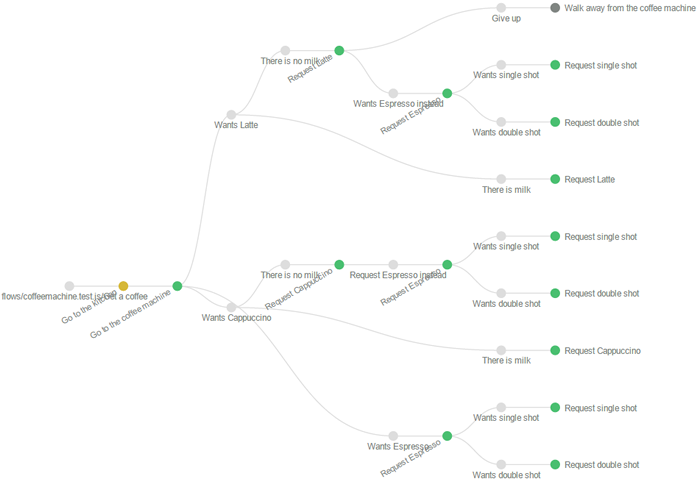
The demo describes a fictional Coffee machine application. Please note that test files must use the '.test.js' suffix.
flow("Get a coffee", function(){
	step("Go to the kitchen", goToKitchen);
	step("Go to the coffee machine", goToMachine);
	decision({
		"Wants Latte": function(){
			chance({
				"There is no milk": function(){
					step("Request Latte", requestLatte_fail);
					decision({
						"Give up": function(){
							step("Walk away from the coffee machine", walkAway);
						},
						"Wants Espresso instead": wantsEspresso
					});
				},
				"There is milk": function(){
					step("Request Latte", requestLatte_success);
				}
			});
		},
		"Wants Cappuccino": function(){
			chance({
				"There is no milk": function(){
					step("Request Cappuccino", requestCappuccino_fail);
					decision({
						"Request Espresso instead": wantsEspresso
					});
				},
				"There is milk": function(){
					step("Request Cappuccino", requestCappuccino_success);
				}
			});
		},
		"Wants Espresso": wantsEspresso
	});
});
And below is the visualisation generated by this simple feature test.

Deciding how to visualise this data is the hard part. It has to be readable and insightful. These visualisations are still evolving, it would be great to see contributions for better visualisations. Visit d3js.org for inspiration.
	var flow = require('../phantomflow').init({
		// debug: 2
		// createReport: true,
		// test: 'coffee'
	});

	// flow.report(); // Show report

	flow.run(function(code){
		process.exit(code); // callback is executed when PhantomFlow is complete
	});
--ignore-ssl-errors=trueTest execution is parallelised for increased speed and a reduced test to dev feedback loop. By default your tests will be divided and run on up to 4 spawned processes. You can change the default number of threads to any number you think your machine can handle.
Debugging is often a painful part of writing tests with PhantomJS. If you're experiencing trouble try the following.
	var flow = require('../phantomflow').init({
		debug: 1
	});
	var flow = require('../phantomflow').init({
		debug: 2
	});
	var flow = require('../phantomflow').init({
		remoteDebug: true
		// remoteDebugAutoStart: false
		// remoteDebugPort: 9000
	});
Rebasing is the process of deleting an original visual test, and creating a new baseline, either by renaming the diff image, or running the test suite again to create a new image. The PhantomFlow UI provides a quick way to find and inspect differences, with a 'rebase' button to accept the latest image as the baseline.

PhantomFlow will look for a __coverage__ property on the window object at the end of each test flow. If found the coverage data will be exported to the coverage directory under test-results (or wherever you have set result root folder) as JSON files with the extension .coverage.json. PhantomFlow doesn't handle coverage data itself, but if you've instrumented your application code using a tool like babel-plugin-coverage the exported data can be fed directly into Istanbul. e.g.
istanbul report --include test-results/coverage/**/*.coverage.json --dir coverage html
We've been using this testing style for many months on Huddle's biggest UI application. It's still an evolving idea but for those of us that actively worked on it, it's making a huge difference to the way we think about UI, and how we communicate about UI. It supports TDD well, we use it for 'unit' testing UI but it has great potential for end-to-end as well. I'd also like to do more work on the visualisations, they look great and are very communicable, but they could be a better. Of course, this is an Open Source project and it would be great to see contributions.
Created by James Cryer and the Huddle development team.
FAQs
UI testing with PhantomCSS and Decision Trees
The npm package phantomflow receives a total of 13 weekly downloads. As such, phantomflow popularity was classified as not popular.
We found that phantomflow demonstrated a not healthy version release cadence and project activity because the last version was released a year ago. It has 3 open source maintainers collaborating on the project.
Did you know?

Socket for GitHub automatically highlights issues in each pull request and monitors the health of all your open source dependencies. Discover the contents of your packages and block harmful activity before you install or update your dependencies.

Security News
Critics call the Node.js EOL CVE a misuse of the system, sparking debate over CVE standards and the growing noise in vulnerability databases.

Security News
cURL and Go security teams are publicly rejecting CVSS as flawed for assessing vulnerabilities and are calling for more accurate, context-aware approaches.

Security News
Bun 1.2 enhances its JavaScript runtime with 90% Node.js compatibility, built-in S3 and Postgres support, HTML Imports, and faster, cloud-first performance.