React Frappe Charts
React wrapper for Frappe Charts with TypeScript definitions and Storybook playground


Installation
React Frappe Charts requires React 16.8.0 or later.
$ npm install --save frappe-charts react-frappe-charts
Usage
import ReactFrappeChart from "react-frappe-charts";
export default function MyChart(props) {
return (
<ReactFrappeChart
type="bar"
colors={["#21ba45"]}
axisOptions={{ xAxisMode: "tick", yAxisMode: "tick", xIsSeries: 1 }}
height={250}
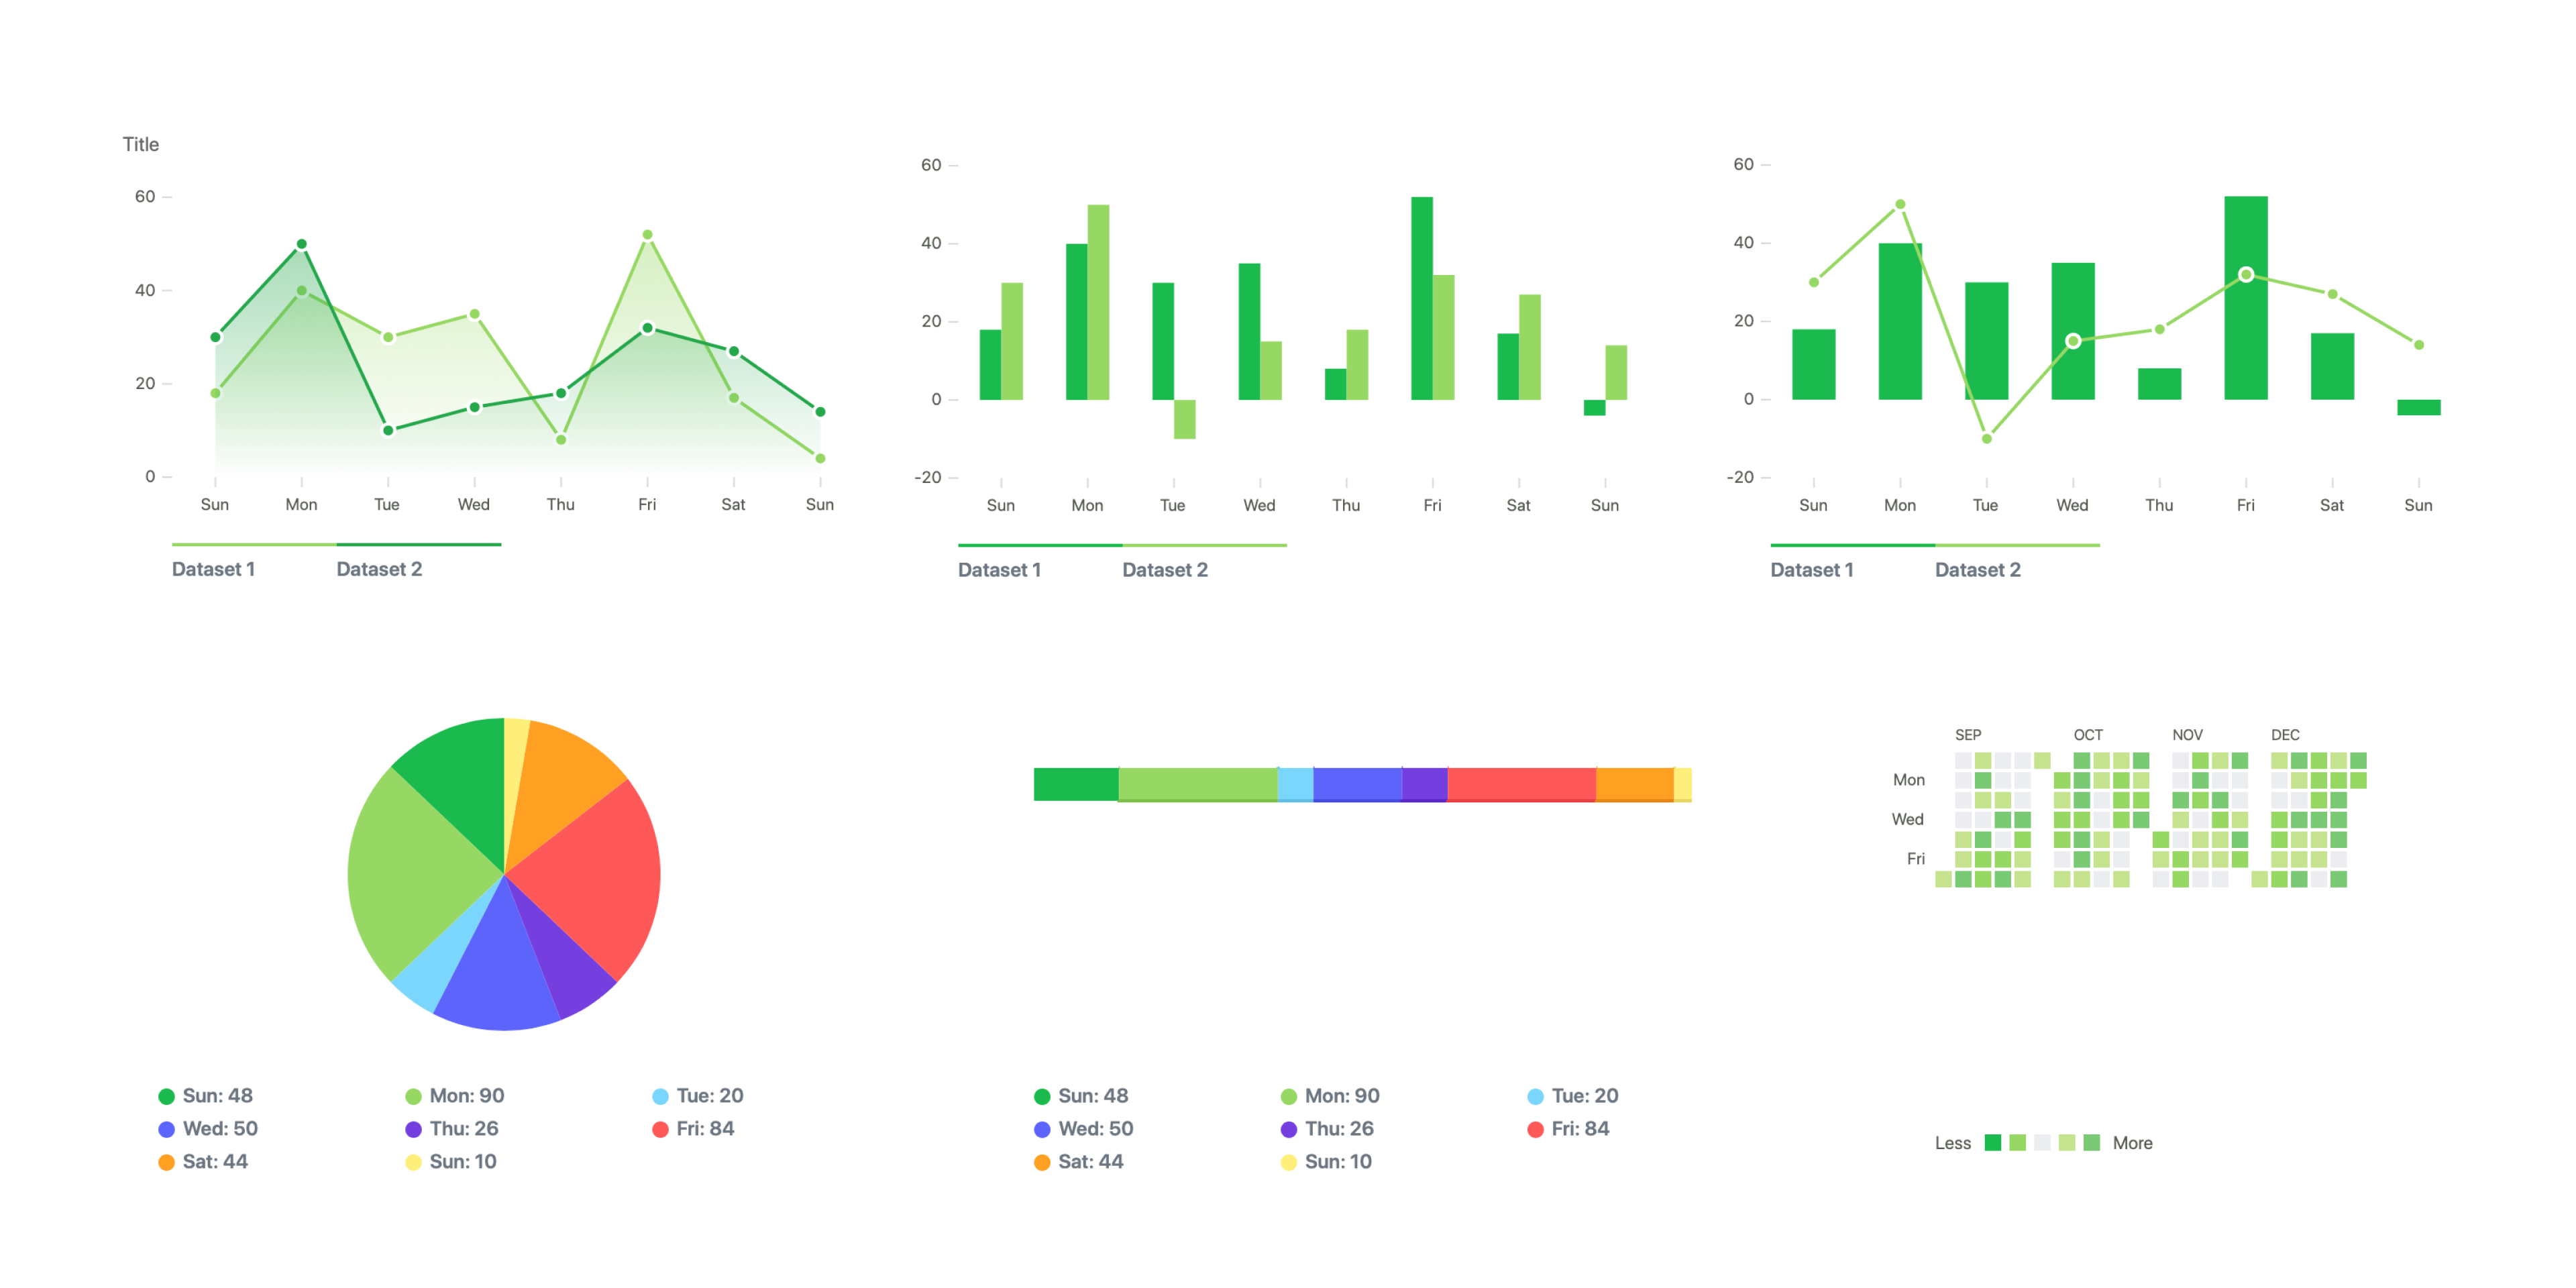
data={{
labels: ["Sun", "Mon", "Tue", "Wed", "Thu", "Fri", "Sat", "Sun"],
datasets: [{ values: [18, 40, 30, 35, 8, 52, 17, 4] }],
}}
/>
);
}
Updating the data prop would update the chart with new data.
With Next.js
The underlying frappe-charts library should be transpiled to avoid module loading issues. Install next-transpile-modules with your package manager and then use the following code snippet:
const withTM = require("next-transpile-modules")(["frappe-charts"]);
module.exports = withTM({
});
Export Chart
In order to export a chart we need to forward a ref to invoke the chart.export() feature from Frappe Charts.
Example:
import React, { useRef } from "react";
import ReactFrappeChart from "react-frappe-charts";

export default function MyChart(props) {
  const chartRef = useRef();

  const exportChart = () => {
    if (chartRef && chartRef.current) {
      chartRef.current.export();
    }
  };

  return (
    <div>
      <ReactFrappeChart
        ref={chartRef}
        type="bar"
        colors={["#21ba45"]}
        axisOptions={{ xAxisMode: "tick", yAxisMode: "tick", xIsSeries: 1 }}
        height={250}
        data={{
          labels: ["Sun", "Mon", "Tue", "Wed", "Thu", "Fri", "Sat", "Sun"],
          datasets: [{ values: [18, 40, 30, 35, 8, 52, 17, 4] }],
        }}
      />
      <button onClick={exportChart} type="button">
        Export
      </button>
    </div>
  );
}
Playground
Use Storybook Playground to tweak different props and see their effect on the chart rendered
Contributing
PRs are welcome!