
Product
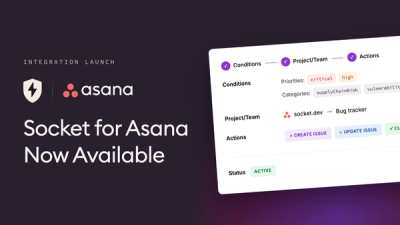
Socket for Asana Is Now Available
Create and manage Asana tasks directly from Socket alerts, with manual task creation, automated ticketing rules, and two-way sync.
By Jeppe Hasseriis - Aug 25, 2026
react-native-ai-debugger
Advanced tools
MCP server for AI-powered React Native debugging - logs, REPL, state inspection
An MCP (Model Context Protocol) server for AI-powered React Native debugging. Enables AI assistants like Claude to capture logs, execute code, inspect state, and control navigation in your React Native app.
console.log, console.warn, console.error from React Native appsbrew install idb-companionNo installation required - Claude Code uses npx to run the latest version automatically.
claude mcp add rn-debugger --scope user -- npx react-native-ai-debugger
claude mcp add rn-debugger --scope project -- npx react-native-ai-debugger
Add to ~/.claude.json (user scope) or .mcp.json (project scope):
{
    "mcpServers": {
        "rn-debugger": {
            "type": "stdio",
            "command": "npx",
            "args": ["react-native-ai-debugger"]
        }
    }
}
Restart Claude Code after adding the configuration.
Requires VS Code 1.102+ with Copilot (docs).
Via Command Palette: Cmd+Shift+P → "MCP: Add Server"
Manual config - add to .vscode/mcp.json:
{
    "servers": {
        "rn-debugger": {
            "type": "stdio",
            "command": "npx",
            "args": ["-y", "react-native-ai-debugger"]
        }
    }
}
Via Command Palette: Cmd+Shift+P → "View: Open MCP Settings"
Manual config - add to .cursor/mcp.json (project) or ~/.cursor/mcp.json (global):
{
    "mcpServers": {
        "rn-debugger": {
            "command": "npx",
            "args": ["-y", "react-native-ai-debugger"]
        }
    }
}
| Tool | Description |
|---|---|
scan_metro | Scan for running Metro servers and auto-connect |
connect_metro | Connect to a specific Metro port |
get_apps | List connected React Native apps |
get_logs | Retrieve console logs (with optional filtering and start position) |
search_logs | Search logs for specific text (case-insensitive) |
clear_logs | Clear the log buffer |
| Tool | Description |
|---|---|
get_network_requests | Retrieve captured network requests with optional filtering |
search_network | Search requests by URL pattern (case-insensitive) |
get_request_details | Get full details of a request (headers, body, timing) |
get_network_stats | Get statistics: counts by method, status code, domain |
clear_network | Clear the network request buffer |
| Tool | Description |
|---|---|
execute_in_app | Execute JavaScript code in the connected app and return the result |
list_debug_globals | Discover available debug objects (Apollo, Redux, Expo Router, etc.) |
inspect_global | Inspect a global object to see its properties and callable methods |
reload_app | Reload the app (like pressing 'r' in Metro or shaking the device) |
get_debug_server | Get the debug HTTP server URL for browser-based viewing |
| Tool | Description |
|---|---|
list_android_devices | List connected Android devices and emulators via ADB |
android_screenshot | Take a screenshot from an Android device/emulator |
android_install_app | Install an APK on an Android device/emulator |
android_launch_app | Launch an app by package name |
android_list_packages | List installed packages (with optional filter) |
android_tap | Tap at specific coordinates on screen |
android_long_press | Long press at specific coordinates |
android_swipe | Swipe from one point to another |
android_input_text | Type text at current focus point |
android_key_event | Send key events (HOME, BACK, ENTER, etc.) |
android_get_screen_size | Get device screen resolution |
android_find_element | Find element by text/contentDesc/resourceId (no screenshot) |
android_wait_for_element | Wait for element to appear (useful for screen transitions) |
| Tool | Description |
|---|---|
list_ios_simulators | List available iOS simulators |
ios_screenshot | Take a screenshot from an iOS simulator |
ios_install_app | Install an app bundle (.app) on a simulator |
ios_launch_app | Launch an app by bundle ID |
ios_open_url | Open a URL (deep links or web URLs) |
ios_terminate_app | Terminate a running app |
ios_boot_simulator | Boot a simulator by UDID |
ios_find_element | Find element by label/value (requires IDB, no screenshot) |
ios_wait_for_element | Wait for element to appear (requires IDB) |
Start your React Native app:
npm start
# or
expo start
In Claude Code, scan for Metro:
Use scan_metro to find and connect to Metro
Get logs:
Use get_logs to see recent console output
get_logs with maxLogs=20 and level="error"
Available levels: all, log, warn, error, info, debug
get_logs with startFromText="iOS Bundled" and maxLogs=100
This finds the last (most recent) line containing the text and returns logs from that point forward. Useful for getting logs since the last app reload.
search_logs with text="error" and maxResults=20
Case-insensitive search across all log messages.
get_network_requests with maxRequests=20
get_network_requests with method="POST"
Useful for debugging auth issues:
get_network_requests with status=401
search_network with urlPattern="api/auth"
After finding a request ID from get_network_requests:
get_request_details with requestId="123.45"
Shows full headers, request body, response headers, and timing.
get_network_stats
Example output:
Total requests: 47
Completed: 45
Errors: 2
Avg duration: 234ms

By Method:
  GET: 32
  POST: 15

By Status:
  2xx: 43
  4xx: 2

By Domain:
  api.example.com: 40
  cdn.example.com: 7
The MCP server includes a built-in web dashboard for viewing logs and network requests in your browser. This is useful for real-time monitoring without using MCP tools.
Use the get_debug_server tool to find the dashboard URL:
get_debug_server
The server automatically finds an available port starting from 3456. Each MCP instance gets its own port, so multiple Claude Code sessions can run simultaneously.
| URL | Description |
|---|---|
/ | Dashboard with overview stats |
/logs | Console logs with color-coded levels |
/network | Network requests with expandable details |
/apps | Connected React Native apps |
POST  200  https://api.example.com/graphql         1ms  ▶
           GetMeetingsBasic (timeFilter: "Future", first: 20)
For programmatic access, JSON endpoints are also available:
| URL | Description |
|---|---|
/api/status | Server status and buffer sizes |
/api/logs | All logs as JSON |
/api/network | All network requests as JSON |
/api/bundle-errors | Metro bundle errors as JSON |
/api/apps | Connected apps as JSON |
Find what debugging objects are available in your app:
list_debug_globals
Example output:
{
    "Apollo Client": ["__APOLLO_CLIENT__"],
    "Redux": ["__REDUX_STORE__"],
    "Expo": ["__EXPO_ROUTER__"],
    "Reanimated": ["__reanimatedModuleProxy"]
}
Before calling methods on an unfamiliar object, inspect it to see what's callable:
inspect_global with objectName="__EXPO_ROUTER__"
Example output:
{
    "navigate": { "type": "function", "callable": true },
    "push": { "type": "function", "callable": true },
    "currentPath": { "type": "string", "callable": false, "value": "/" },
    "routes": { "type": "array", "callable": false }
}
Run JavaScript directly in the connected app:
execute_in_app with expression="__DEV__"
// Returns: true

execute_in_app with expression="__APOLLO_CLIENT__.cache.extract()"
// Returns: Full Apollo cache contents

execute_in_app with expression="__EXPO_ROUTER__.navigate('/settings')"
// Navigates the app to /settings
For async operations, promises are awaited by default:
execute_in_app with expression="AsyncStorage.getItem('userToken')"
Set awaitPromise=false for synchronous execution only.
List connected devices:
list_android_devices
Take a screenshot:
android_screenshot
Tap on screen (coordinates in pixels):
android_tap with x=540 y=960
Swipe gesture:
android_swipe with startX=540 startY=1500 endX=540 endY=500
Type text (tap input field first):
android_tap with x=540 y=400
android_input_text with text="hello@example.com"
Send key events:
android_key_event with key="BACK"
android_key_event with key="HOME"
android_key_event with key="ENTER"
List available simulators:
list_ios_simulators
Boot a simulator:
ios_boot_simulator with udid="XXXXXXXX-XXXX-XXXX-XXXX-XXXXXXXXXXXX"
Take a screenshot:
ios_screenshot
Launch an app:
ios_launch_app with bundleId="com.example.myapp"
Open a deep link:
ios_open_url with url="myapp://settings"
For action triggering without layout debugging, use element-based tools instead of screenshots. This is 2-3x faster and uses fewer tokens.
# Wait for screen to load
android_wait_for_element with text="Login"

# Find element (returns tap coordinates)
android_find_element with textContains="submit"

# Tap the element (use coordinates from find_element)
android_tap with x=540 y=960
Search options:
text - exact text matchtextContains - partial text (case-insensitive)contentDesc - accessibility content descriptioncontentDescContains - partial content descriptionresourceId - resource ID (e.g., "button" or "com.app:id/button")# Install IDB first
brew install idb-companion
# Wait for element
ios_wait_for_element with label="Sign In"

# Find element by partial label
ios_find_element with labelContains="welcome"
Search options:
label - exact accessibility labellabelContains - partial label (case-insensitive)value - accessibility valuevalueContains - partial valuetype - element type (e.g., "Button", "TextField")Both platforms support waiting with timeout:
android_wait_for_element with text="Dashboard" timeoutMs=15000 pollIntervalMs=500
ios_wait_for_element with label="Home" timeoutMs=10000
Always try accessibility tools first, fall back to screenshots only when needed:
wait_for_element with expected text/labelfind_element to get tap coordinatestap with coordinates from step 2screenshot# Example: Tap "Submit" button after screen loads
android_wait_for_element with text="Submit" # Step 1: Wait
android_find_element with text="Submit" # Step 2: Find (returns center coordinates)
android_tap with x=540 y=1200 # Step 3: Tap (use returned coordinates)
Why this order?
find_element: ~100-200 tokens, <100msscreenshot: ~400-500 tokens, 200-500ms| Use Case | Recommended Tool |
|---|---|
| Trigger button taps | find_element + tap |
| Wait for screen load | wait_for_element |
| Navigate through flow | wait_for_element + tap |
| Debug layout issues | screenshot |
| Verify visual appearance | screenshot |
| Find elements without labels | screenshot |
| Version | Runtime | Status |
|---|---|---|
| Expo SDK 54+ | React Native Bridgeless | ✓ |
| RN 0.70 - 0.76 | Hermes React Native | ✓ |
| RN < 0.70 | JSC | Not tested |
/json endpointRuntime.enable to receive Runtime.consoleAPICalled eventsNetwork.enable to receive network request/response eventsnpm start)The server prioritizes devices in this order:
clear_logs then trigger some actions in the appget_apps to verify connection statusMIT
FAQs
React Native AI debugger: MCP server giving AI agents eyes and hands in your running app (logs, network, state inspection, tap, screenshot). Published as ExecBro.
The npm package react-native-ai-debugger receives a total of 690 weekly downloads. As such, react-native-ai-debugger popularity was classified as not popular.
We found that react-native-ai-debugger demonstrated a healthy version release cadence and project activity because the last version was released less than a year ago. It has 1 open source maintainer collaborating on the project.
Product
Create and manage Asana tasks directly from Socket alerts, with manual task creation, automated ticketing rules, and two-way sync.

Security News
Open VSX has removed three extension IDs from its malicious-extension list as the legitimate publishers they impersonated move to claim the names for themselves.

Product
Socket’s PHP and Composer support is now in Beta for all customers, with PHP reachability analysis generally available.