React Native Chart Kit Chz
Developed By Chzapps India
More Charts are adding soon!
Any Changes? Here
Installation
yarn add react-native-svg
yarn add react-native-chart-kit-chz
charts
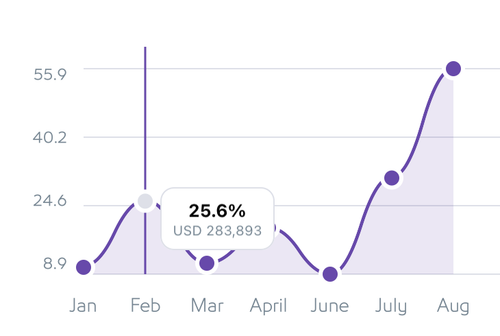
Line Chart
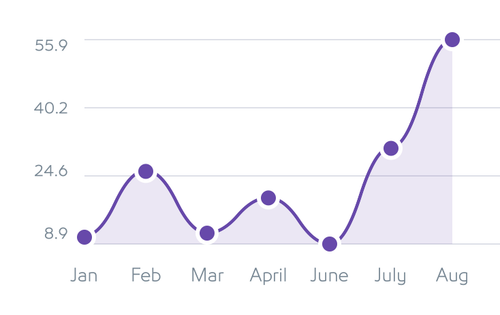
import {LineChart} from "react-native-chart-kit-chz"
<LineChart
data={{
labels: ["Jan", "Feb", "Mar", "April", "June", "July", "Aug"],
datasets: [
{
data: [10.47, 25.6, 11.4, 19.5, 8.9, 30.9, 55.9],
amount: [5093995050, 283893, 382389, 80909, 48908, 893022, 2839090],
color: "#000531",
currency: "USD",
id: 1,
},
],
}}
onPointPress={(d: any) => {
console.log("chart_Data", d);
}}
selectedDotColor="#000"
width={Dimensions.get("window").width}
height={200}
chartConfig={{
decimalPlaces: 1,
color: `#000531`,
}}
bezier
style={{
marginVertical: 30,
}}
/>;
Donut Chart

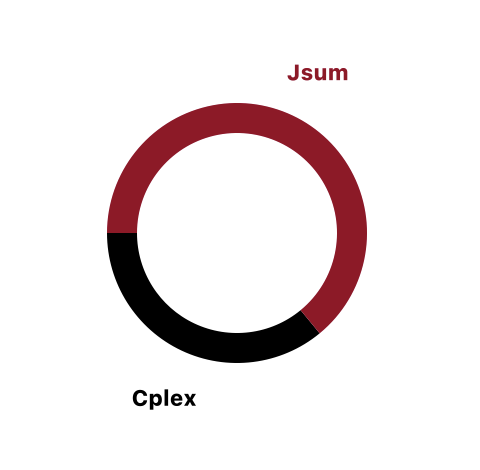
Note : Label need to be created from your end Example
import {PieChart} from "react-native-chart-kit-chz"
  const chartData = [
    {
      key: 1,
      value: 100,
      svg: {fill: '#000'},
      arc: {cornerRadius: 0},
      label: 'Cplex',
    },
    {
      key: 2,
      value: 178,
      svg: {fill: '#902'},
      arc: {cornerRadius: 0},
      label: 'Jsum',
    },
  ];

   <PieChart
     style={{width: 320, height: 320}}
     items={chartData}
     innerRadius={50}
     outerRadius={65}
     padAngle={0}}
     />
Pie Chart
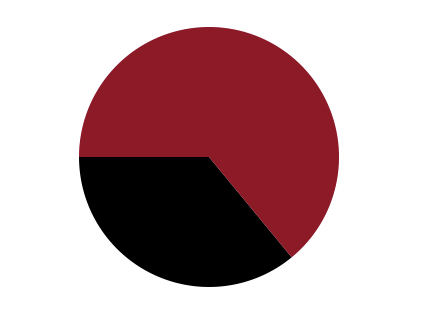
Note : Label need to be created from your end Example
import {PieChart} from "react-native-chart-kit-chz"
  const chartData = [
    {
      key: 1,
      value: 100,
      svg: {fill: '#000'},
      arc: {cornerRadius: 0},
      label: 'Cplex',
    },
    {
      key: 2,
      value: 178,
      svg: {fill: '#902'},
      arc: {cornerRadius: 0},
      label: 'Jsum',
    },
  ];

   <PieChart
     style={{width: 320, height: 320}}
     items={chartData}
     innerRadius={0}
     outerRadius={65}
     padAngle={0}}
     />
Funnel Chart
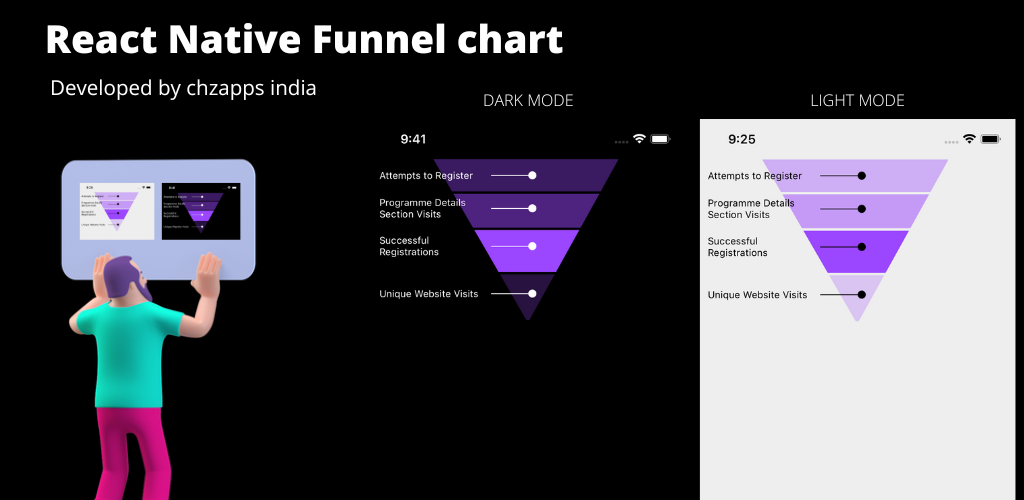
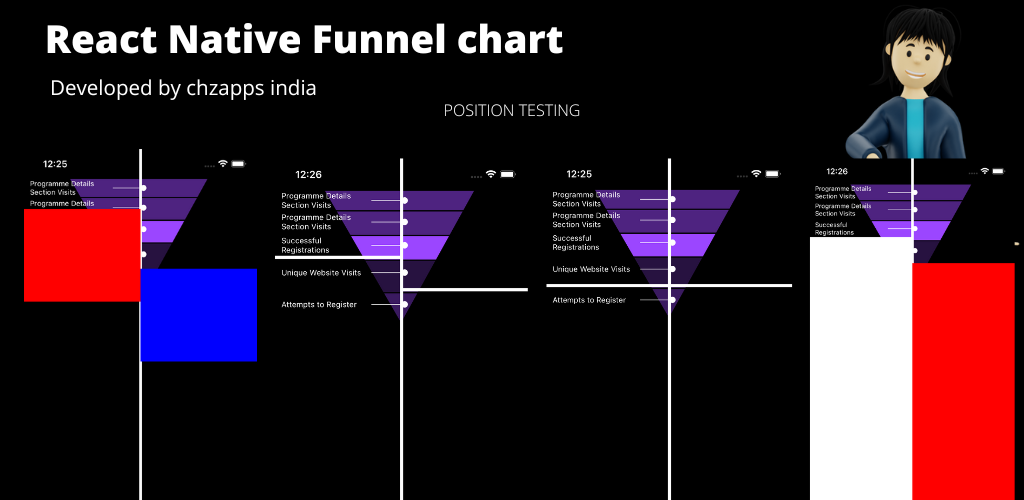
import {FunnelChart} from "react-native-chart-kit-chz"
  const demo_data = [
  {
    label: 'Unique Website Visits',
    value: '13589',
    color: '#9b46ff40',
  },
  {
    label: 'Programme Details Section Visits',
    value: '8855',
    color: '#9b46ff80',
  },
  {
    label: 'Attempts to Register',
    value: '8453',
    color: '#9b46ff60',
  },
  {
    label: 'Successful Registrations',
    value: '10586',
    color: '#9b46ff',
  },
];


 <FunnelChart
          animated
          data={demo_data}
          backgroundColor={'#000'}
          height={200}
          lineColor={'#fff'}
          space={3}
          fontSize={12}
          textColor={'#fff'}
        />