Security News
JSR Working Group Kicks Off with Ambitious Roadmap and Plans for Open Governance
At its inaugural meeting, the JSR Working Group outlined plans for an open governance model and a roadmap to enhance JavaScript package management.
react-native-chart-kit-chz
Advanced tools
React Native Chart Kit with Line Charts, Pie Charts and more
Developed By Chzapps India
More Charts are adding soon!
Any Changes? Here
yarn add react-native-svg
yarn add react-native-chart-kit-chz
import {LineChart} from "react-native-chart-kit-chz"
<LineChart
  data={{
    labels: ["Jan", "Feb", "Mar", "April", "June", "July", "Aug"], // Bottom Labels
    datasets: [
      {
        data: [10.47, 25.6, 11.4, 19.5, 8.9, 30.9, 55.9], // Data for Chart
        amount: [5093995050, 283893, 382389, 80909, 48908, 893022, 2839090], //Amount show on the ToolTip
        color: "#000531", // Chart Line Color
        currency: "USD", //Currency to show before amount ,
        id: 1, //ID
      },
      //You can add another set here with different data
    ],
  }}
  onPointPress={(d: any) => {
    console.log("chart_Data", d);
  }}
  selectedDotColor="#000"
  width={Dimensions.get("window").width}
  height={200}
  chartConfig={{
    decimalPlaces: 1,
    color: `#000531`,
    // fontFamily: "",
  }}
  bezier //Command this for stright line chart
  style={{
    marginVertical: 30,
  }}
/>;
Note : Label need to be created from your end Example
import {PieChart} from "react-native-chart-kit-chz"
  const chartData = [
    {
      key: 1,
      value: 100,
      svg: {fill: '#000'},
      arc: {cornerRadius: 0},
      label: 'Cplex',
    },
    {
      key: 2,
      value: 178,
      svg: {fill: '#902'},
      arc: {cornerRadius: 0},
      label: 'Jsum',
    },
  ];

   <PieChart
     style={{width: 320, height: 320}}
     items={chartData}
     innerRadius={50}
     outerRadius={65}
     padAngle={0}}
     />
Note : Label need to be created from your end Example
import {PieChart} from "react-native-chart-kit-chz"
  const chartData = [
    {
      key: 1,
      value: 100,
      svg: {fill: '#000'},
      arc: {cornerRadius: 0},
      label: 'Cplex',
    },
    {
      key: 2,
      value: 178,
      svg: {fill: '#902'},
      arc: {cornerRadius: 0},
      label: 'Jsum',
    },
  ];

   <PieChart
     style={{width: 320, height: 320}}
     items={chartData}
     innerRadius={0}
     outerRadius={65}
     padAngle={0}}
     />
import {FunnelChart} from "react-native-chart-kit-chz"
  const demo_data = [
  {
    label: 'Unique Website Visits',
    value: '13589',
    color: '#9b46ff40',
  },
  {
    label: 'Programme Details Section Visits',
    value: '8855',
    color: '#9b46ff80',
  },
  {
    label: 'Attempts to Register',
    value: '8453',
    color: '#9b46ff60',
  },
  {
    label: 'Successful Registrations',
    value: '10586',
    color: '#9b46ff',
  },
];


 <FunnelChart
          animated
          data={demo_data}
          backgroundColor={'#000'}
          height={200}
          lineColor={'#fff'}
          space={3}
          fontSize={12}
          textColor={'#fff'}
        />
FAQs
React Native Chart Kit with Line Charts, Pie Charts and more
The npm package react-native-chart-kit-chz receives a total of 6 weekly downloads. As such, react-native-chart-kit-chz popularity was classified as not popular.
We found that react-native-chart-kit-chz demonstrated a not healthy version release cadence and project activity because the last version was released a year ago. It has 1 open source maintainer collaborating on the project.
Did you know?

Socket for GitHub automatically highlights issues in each pull request and monitors the health of all your open source dependencies. Discover the contents of your packages and block harmful activity before you install or update your dependencies.

Security News
At its inaugural meeting, the JSR Working Group outlined plans for an open governance model and a roadmap to enhance JavaScript package management.

Security News
Research
An advanced npm supply chain attack is leveraging Ethereum smart contracts for decentralized, persistent malware control, evading traditional defenses.

Security News
Research
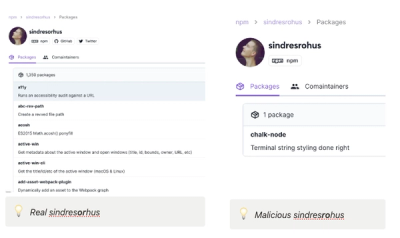
Attackers are impersonating Sindre Sorhus on npm with a fake 'chalk-node' package containing a malicious backdoor to compromise developers' projects.