sitespeed.io


Website | Documentation | Twitter
Welcome to the wonderful world of web performance!
Using sitespeed.io you can:
- Test your web site against Web Performance best practices using the Coach.
- Collect timing metrics like Navigation Timing API and User Timing API from Firefox/Chrome using Browsertime.
- Run your custom-made JavaScript and collect whichever metric(s) you need.
- Test one or multiple pages, across one or many runs to get more-accurate metrics.
- Create HTML-result pages or store the metrics in Graphite.
- Write your own plugins that can do whatever tests you want/need.
See all the latest changes in the Changelog.
And a lot of more things. But what does it look like?
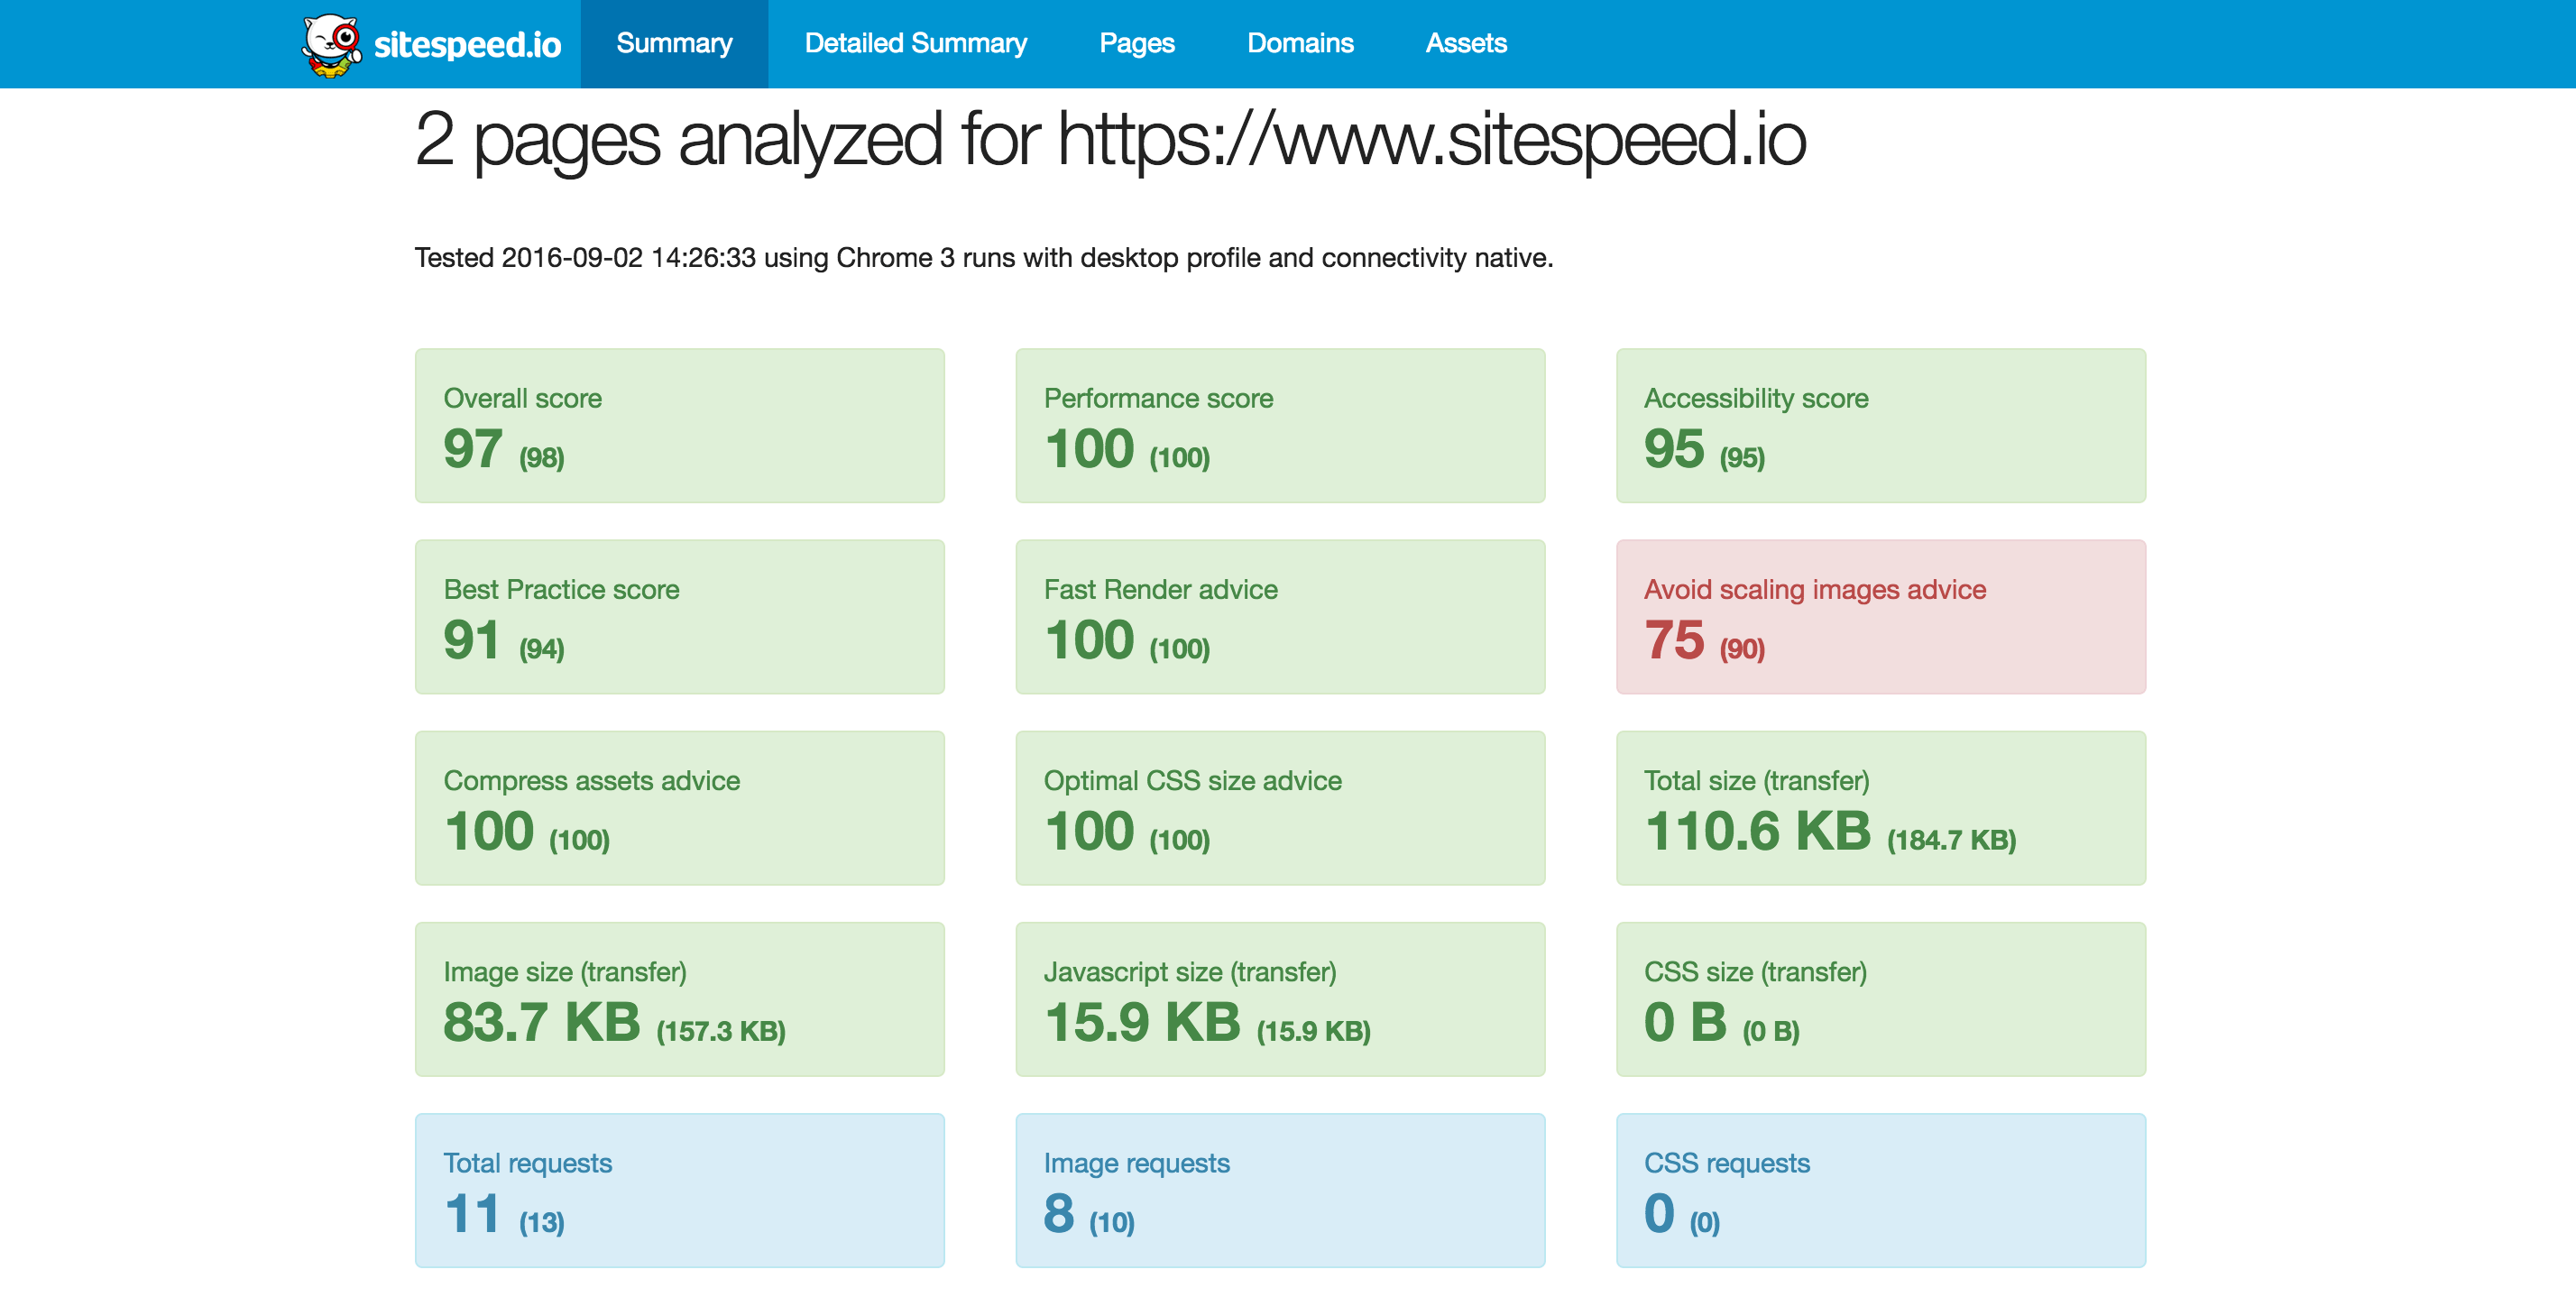
A summary report in HTML:

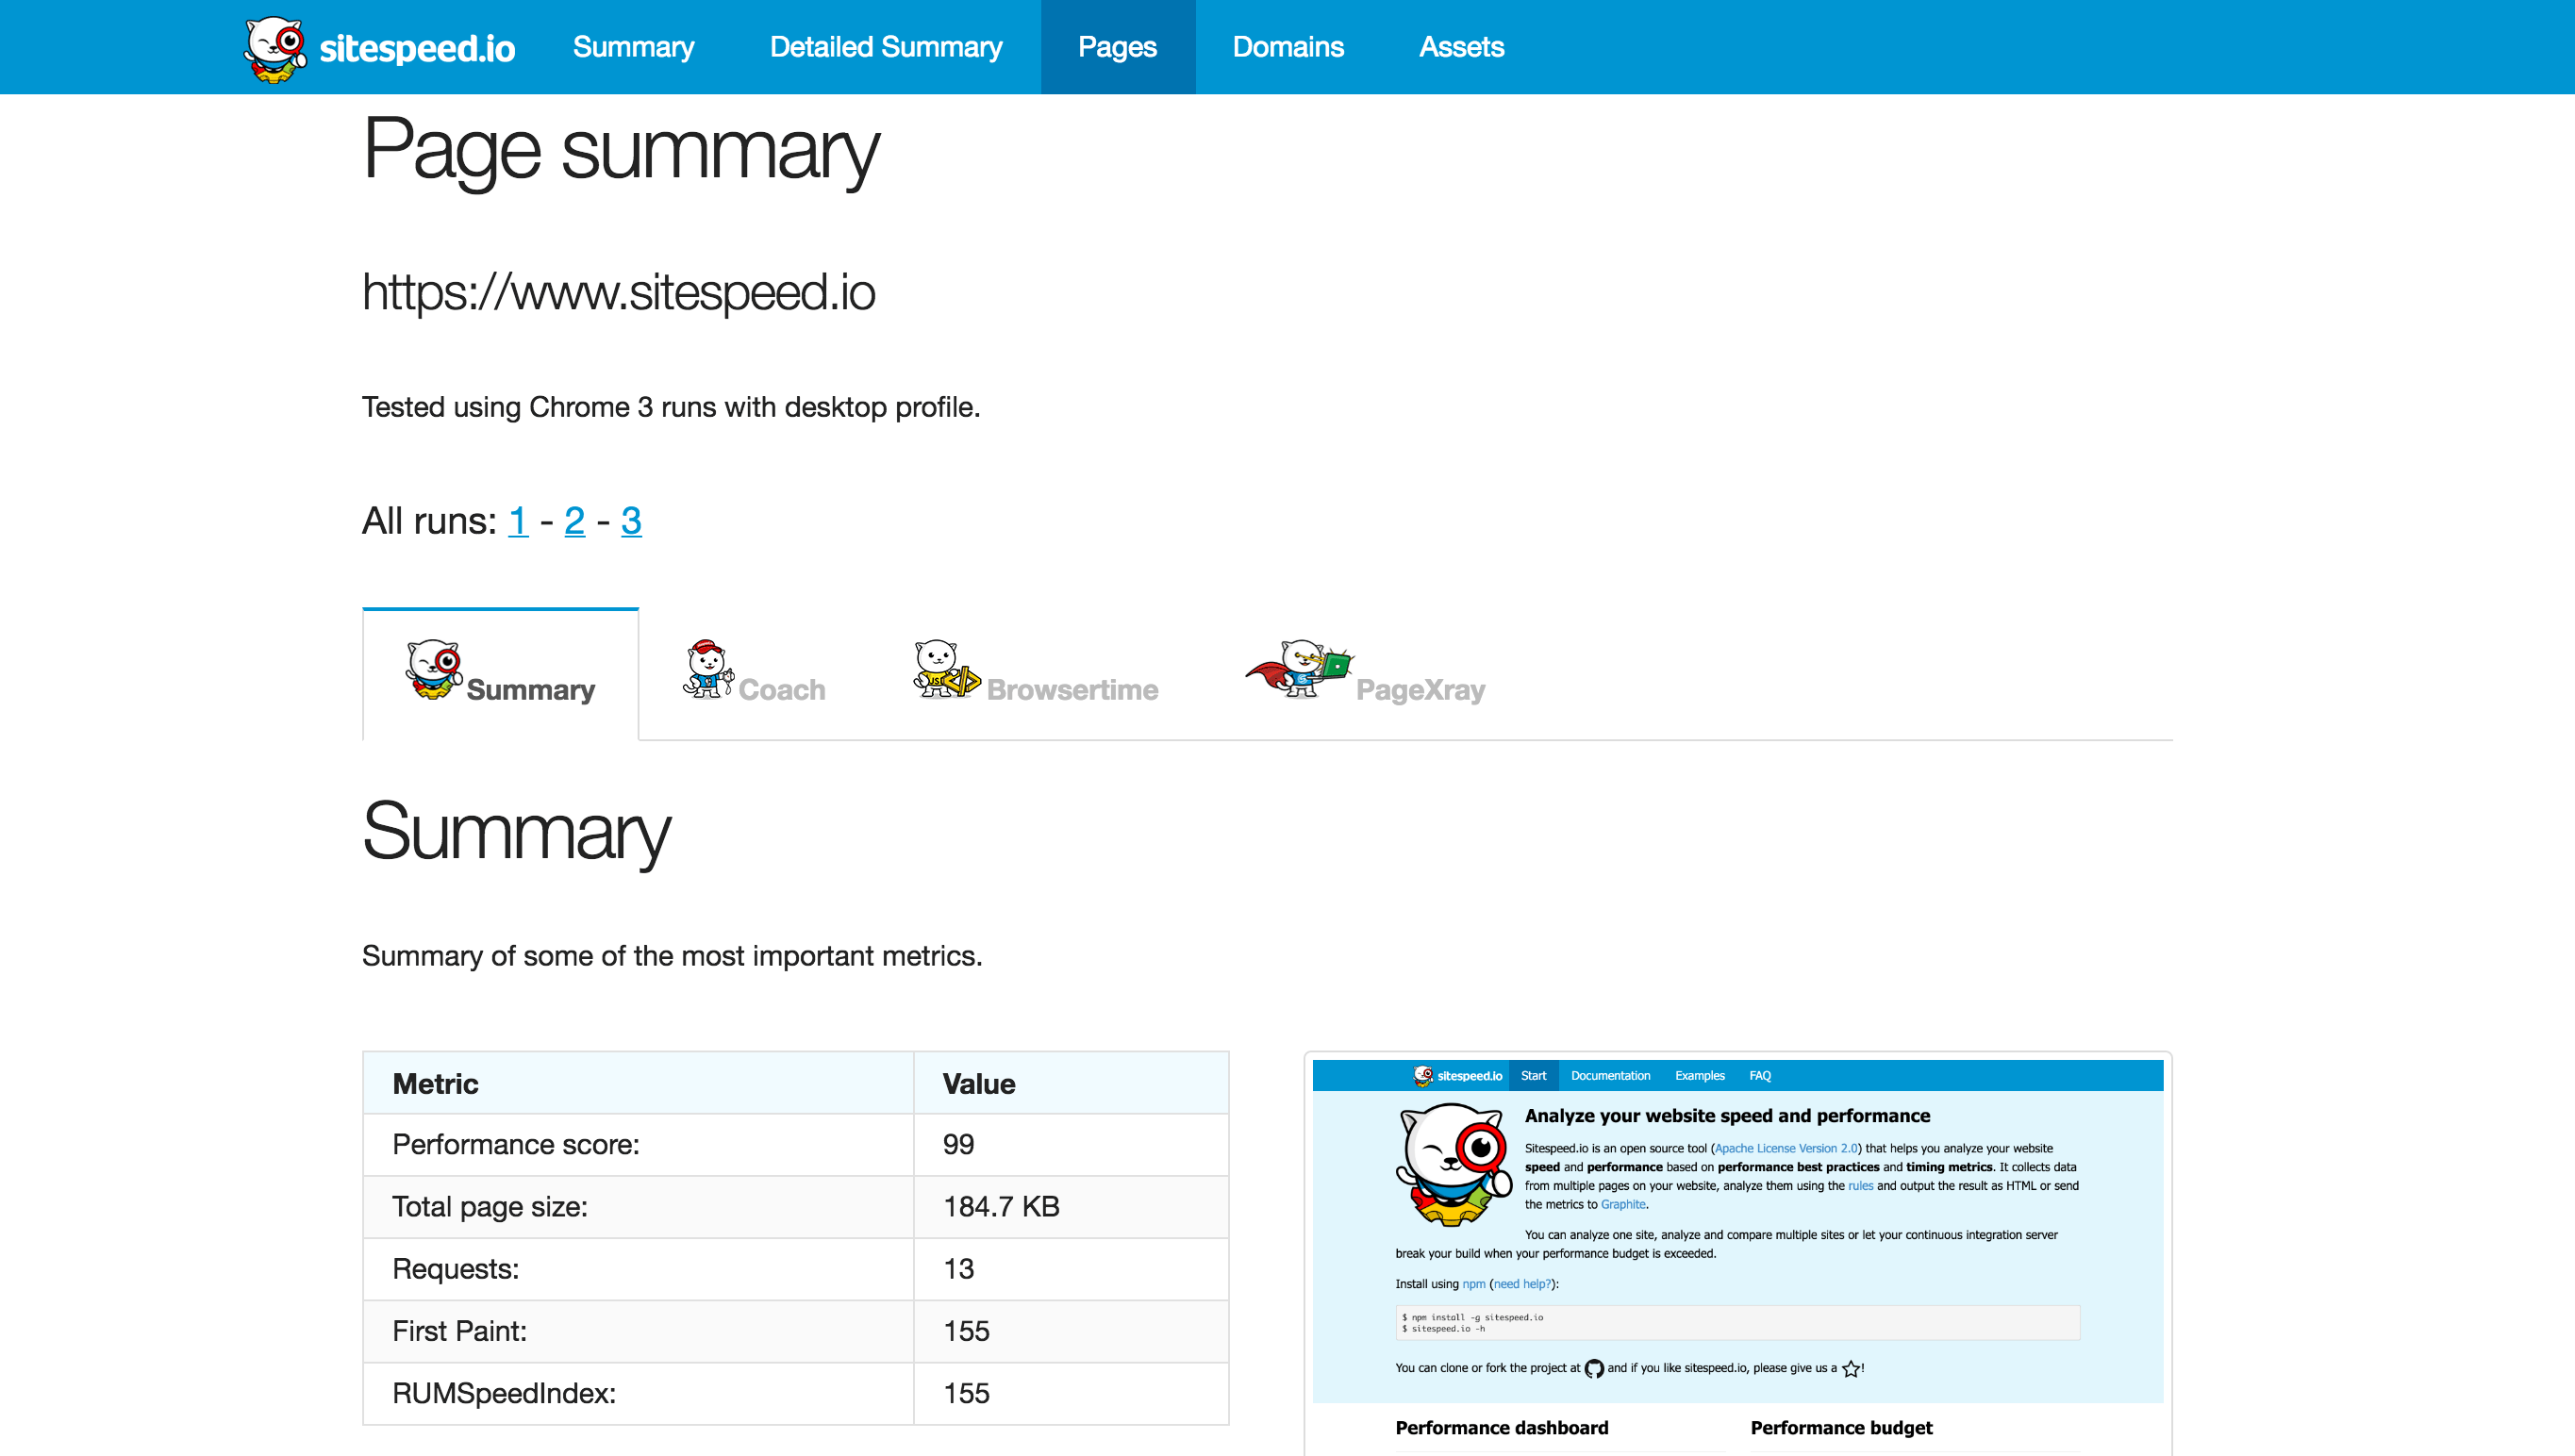
Individual page report:

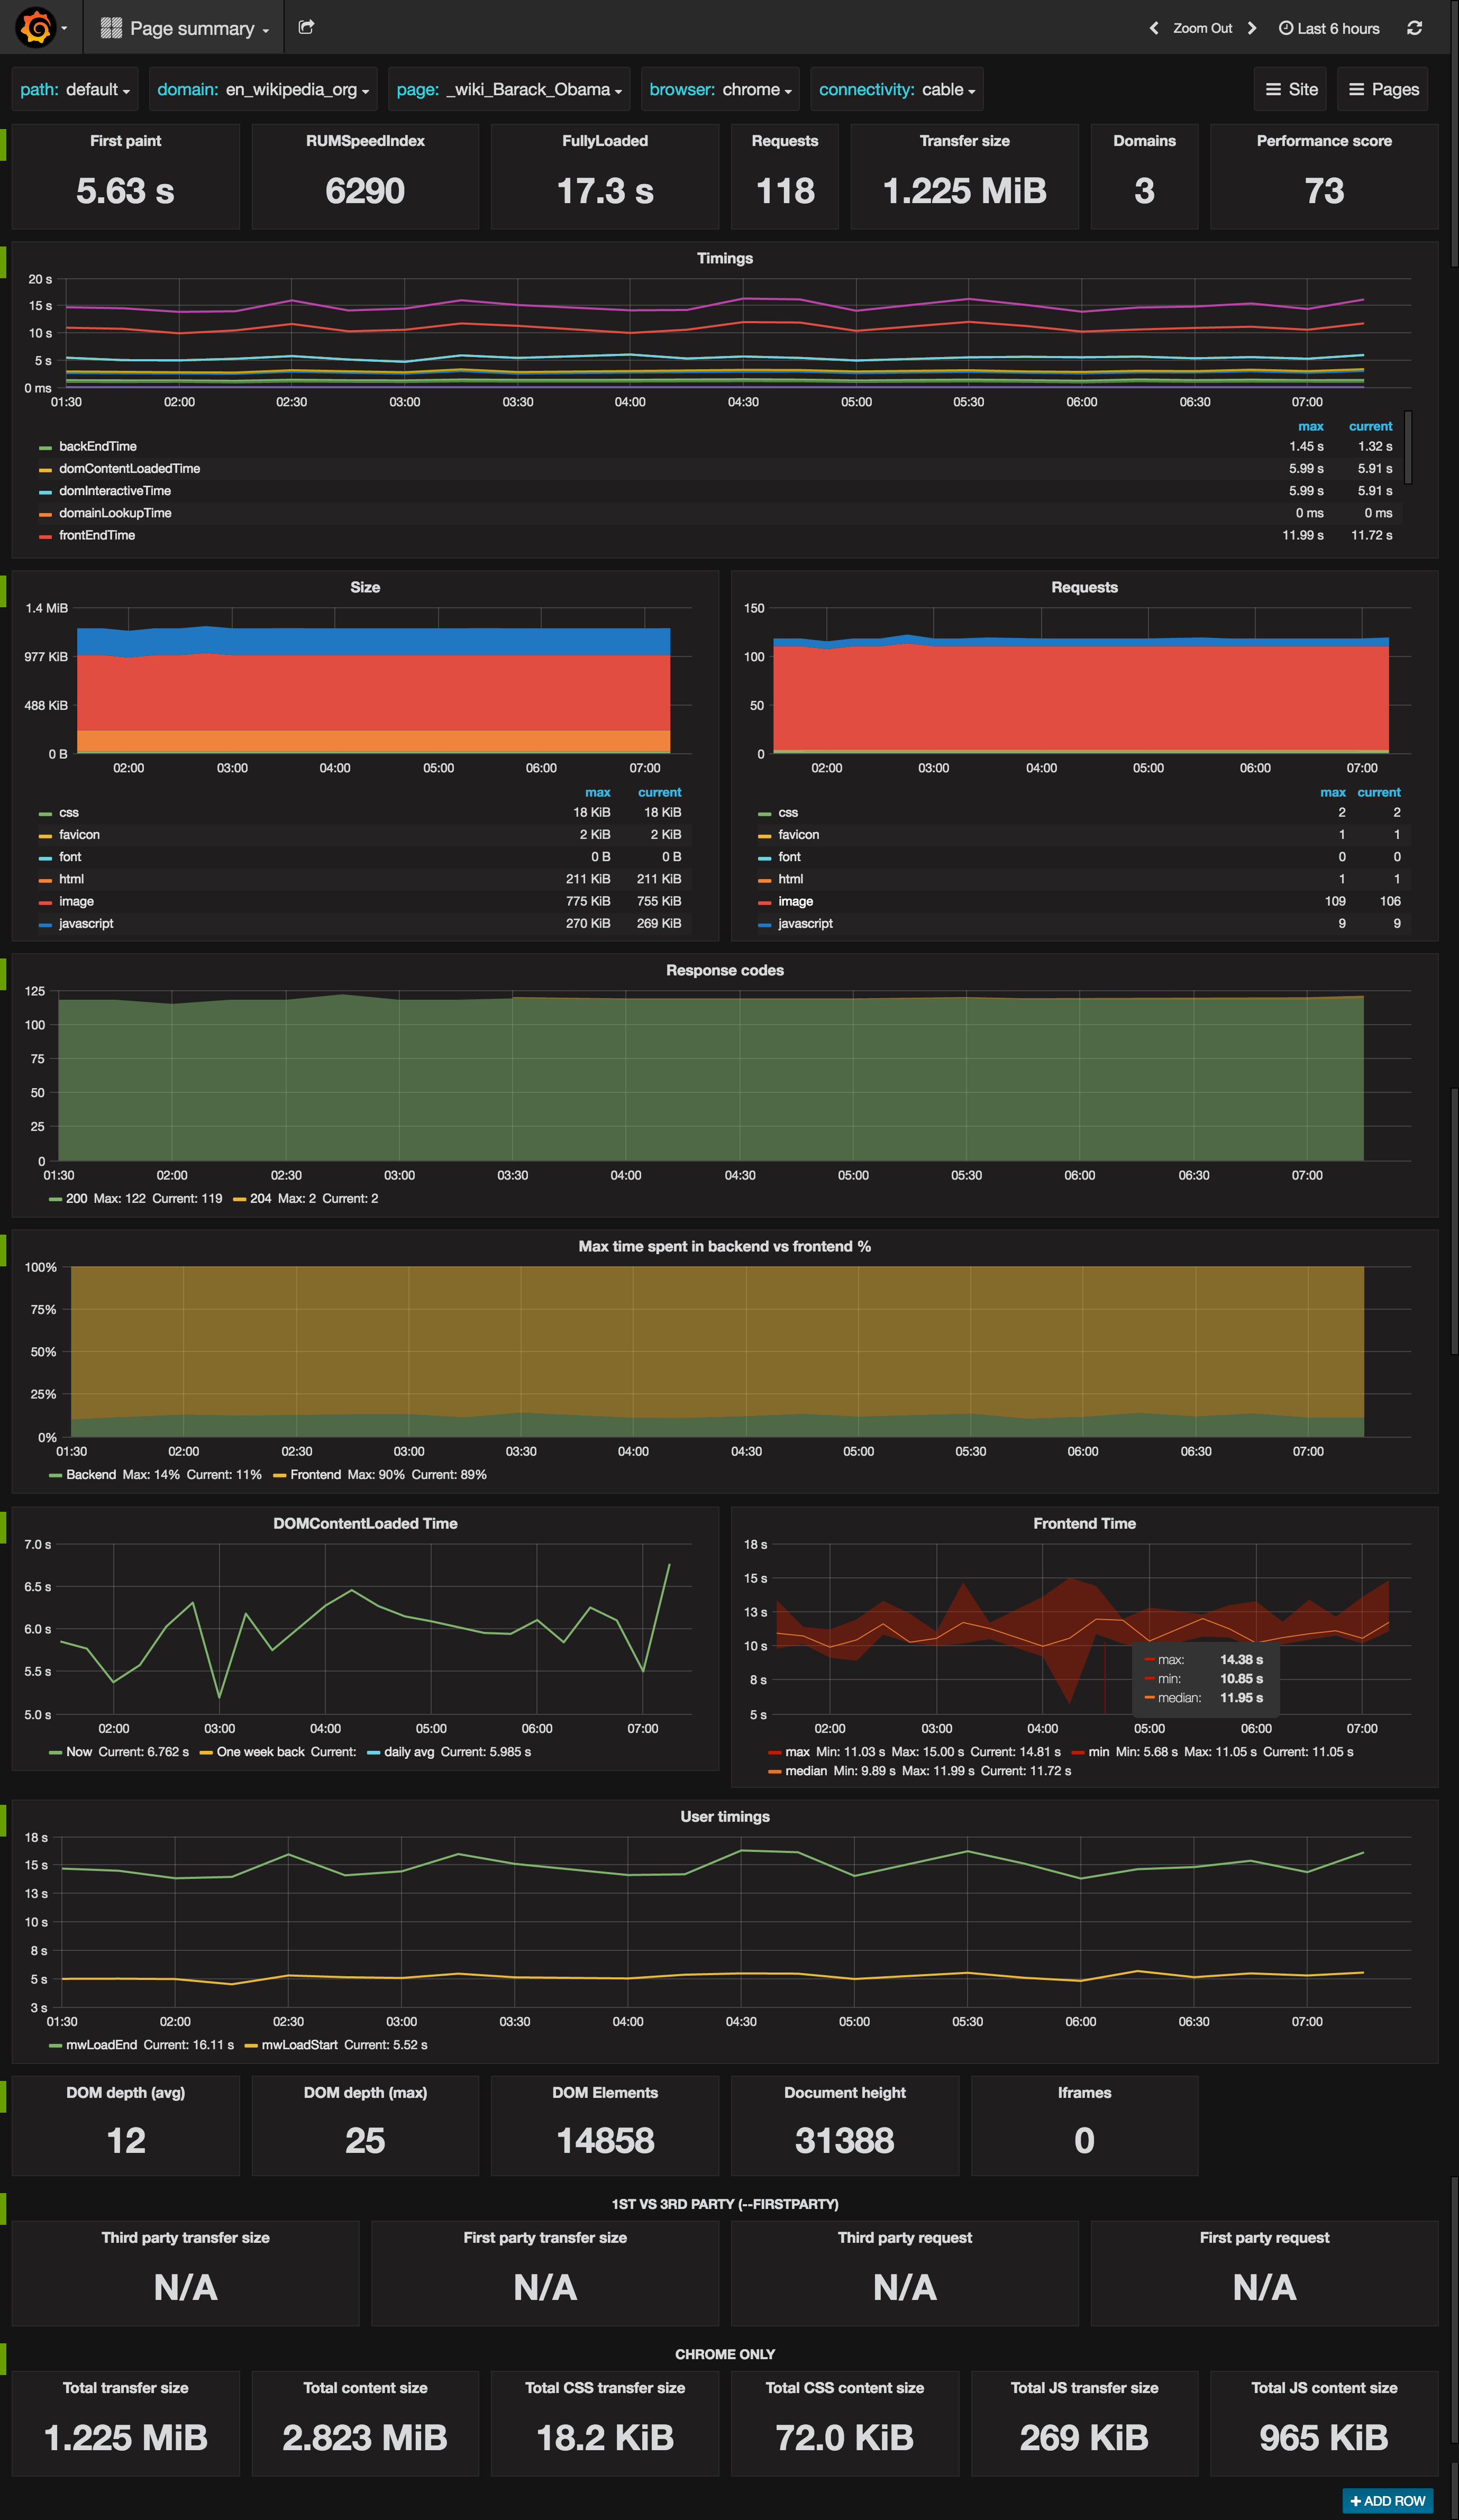
Collected metrics from a URL in Graphite/Grafana:

Video (if you use the Docker version):

4.0
Version 4.0 is a ground-up rewrite for node.js 6.9.1 and newer. It builds on all our experience since shipping 3.0 in December 2014,
the first version to use node.js.
Using Docker (requires 1.10+):
$ docker run --privileged --shm-size=1g --rm -v "$(pwd)":/sitespeed.io sitespeedio/sitespeed.io --video --speedIndex https://www.sitespeed.io/
Or install using npm:
$ npm i -g sitespeed.io
Or clone the repo and test the latest changes:
$ git clone https://github.com/sitespeedio/sitespeed.io.git
$ cd sitespeed.io
$ npm install
$ bin/sitespeed.js --help
$ bin/sitespeed.js http://www.sitespeed.io
Why 4.0?
There's a lot of things that we wanted to improve since 3.0. Here's some of the most important changes:
-
We support HTTP/2! In 3.X we used PhantomJS and a modified version of YSlow to analyze best practice rules. We also had BrowserMobProxy in front of our browsers that made it impossible to collect metrics using H2. We now use the coach and Firefox/Chrome without a proxy. That makes it easier for us to adapt to browser changes and changes in best practices.
-
We now support the feature that people asked about the most: Measure a page as a logged in user. Use --browsertime.preScript to run a selenium task to before the page is analyzed. Documentation is coming soon.
-
New HAR files rock! In the old version we use BrowserMobProxy as a proxy in front of the browser to collect the HAR. In the new version we collect the HAR directly from the browser. For Firefox we use the HAR export trigger and in Chrome we generates it from the performance log.
-
Stability: We have a new completely rewritten version of Browsertime that makes it easier for us to catch errors from the browser, drivers and environment problems.
-
Speed: Yep we dropped Java (it was needed for BrowserMobProxy) and most things are happening in parallel with the new version.
-
Don't overload Graphite: One thing that was annoying with 3.x was that it by default sent a massive amount of metrics to Graphite. That's cool in a way but it was too much. We now send curated metrics by default and you can choose to send more.
-
You can collect metrics from Chrome on an Android phone. In the current version you need to have it connected using USB to the server running sitespeed.io, lets see how we can make it better in the future.
-
Using our Docker container you will get support getting SpeedIndex and startRender using VisualMetrics. This is highly experimental at this stage.
-
We now support video and calculating SpeedIndex (since 4.1). Use our Docker container to get an easy ride.
There are new things that will come also that isn't 100% implemented yet and you can help us.
- InfluxDB support. We have started with a POC but need to implement it properly, see 889.
I want to help!
We have a special page for you!


